This thread has been locked.

If you have a related question, please click the "Ask a related question" button in the top right corner. The newly created question will be automatically linked to this question.

CCS/TM4C129ENCPDT: Statistical Function Profiling does not start

Part Number: TM4C129ENCPDT

Tool/software: Code Composer Studio

Hello,

I am using Code Composer Studio 9.2.0.00013, all features installed. I am using a Debug Probe XDS110. Some days ago, I made a first test with Statistical Function Profiling and it worked perfectly. This morning I got an update message of TI Arm Compiler Tools, I installed them and on reboot CCS crashed. A second restart worked, a short check shows that there are no pending updates.

Now I wanted to do the Statistical Function Profiling - but it does not start. When I select the menu item, after some time an empty menu entry appears (see image)

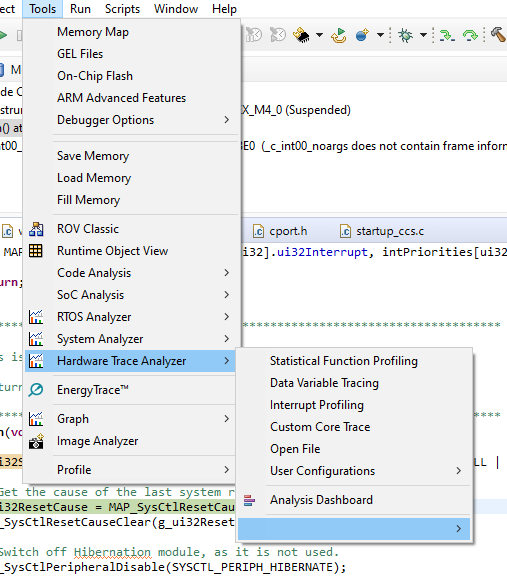
Selecting "Analysis Dashboard" leads to the following message box:

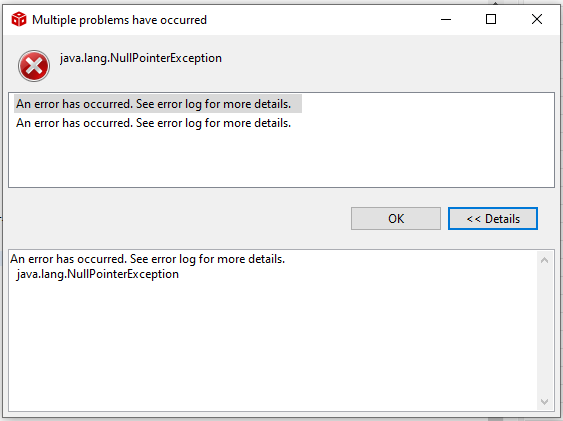
No idea, whether this is related to the crashed update. Is there any idea how to resolve this?

Regards

Klaus

  • Update:

    I reinstalled Code Composer Studio 9.2.0.

    First attempt: Full installation, all updates (-> crash at MSP430 Compiler Tools). Install TI ARM Compiler 19.6.0 STS -> Trace Analyser still doesn't work.

    Second attempt: Selective installation (TI ARM and Sitara). No updates. Install TI ARM Compiler 19.6.0 STS -> Trace Analyser still doesn't work.

    Regards

    Klaus

  • Another check: New installation, TI v18.12.3 LTS. Ignore all updates and no installation of newer STS compiler. Still the same effect. On the other hand the data variable tracing, interrupt profiling and custom core tracing are working.

    Klaus

  • Klaus,

    I am sorry you are having so much trouble. Given the major issues with the Trace seem to be related to the interface itself, I can't help but wonder if the CCS temporary files or something corrupt in the workspace may be influencing this.

    If you haven't changed the workspace across installations, can you check section 9.7.7 of the CCS User's Guide? This is avaialble at the CCS Help (menu Help --> Contents) or at the link below:

    https://software-dl.ti.com/ccs/esd/documents/users_guide/index_troubleshooting.html 

    Other issues may be related to the temporary Trace files (although these would influence the trace data collection itself). Section 9.7.5 of the same user's guide contains the placement where the Trace Cache files are located. 

    Hope this helps,

    Rafael

  • Hi Rafael,

    great - that helped. I deleted this subdirectory - and it works. I remember that I had a crash of Eclipse some days ago. Maybe this destroyed some file in this directory.

    Anyway, thanks a lot, that saved my day :)

    Regards

    Klaus