


Part Number: CC2642R
Tool/software: TI C/C++ Compiler
I'm building a application with TI RTOS in ROM using the tools: TI compiler + Makefile + Eclipse + GDB.
My application is halting a hard fault exception in one of the tasks, however a cannot see the call trace inside the Hard fault handler to figure out which part of the code is halting the exception.
Here is how I register my Hard fault handler:
HwiP_Params         hwiParams;
	HwiP_Params_init(&hwiParams);

	hwiParams.arg = (uintptr_t)NULL;
	hwiParams.priority = ~0;

	HwiP_construct(&(hwiP[1]), INT_HARD_FAULT      , SYS_HardFaultHandler, &(hwiParams));


Here is my Hard fault handler implementation:
void SYS_HardFaultHandler(uintptr_t arg)
{

	while(1)
	{
		__asm volatile
		(
				" nop\n"
		);
	}
}
Here is a sample code to force the hard fault:
memset((void *)0x00, 0, 1);
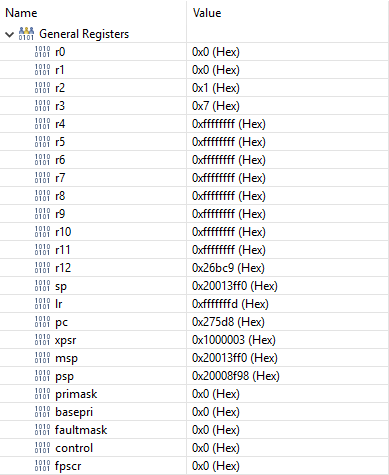
Here is the registers values inside the hard fault handler.
Here is the stack trace. note that I can't see the calls before the exception.

I have already tried to use gdb console to debug msp and psp in order to find the function call trace but it failed. Actually I can't read useful data from psp after the exception but I can before using info frame command in gdb console.

How can I read the stack of the task which was running before the exception happens?
What happens with the stack just after exception?
