Tool/software: Code Composer Studio
Hello,
I've a problem with debugging a large program. It wors to I programmed a long function library and make some changes in the old code.
The compiling prozess produce only 31 warnings: "#515-D a value of type "long" cannot be assigned to an entity of type "__SFR_FARPTR" fram.c /ContainerObserver02 line 632 C/C++ Problem"
I use this: #define __SFR_FARPTR long
How can I fix this problem? It coms at every line with loading command of the 20 bit registers of the DMA-modul. This is an example: DMA0SA = (__SFR_FARPTR)pStart;
But I think the problem of the debugger has an other reason.
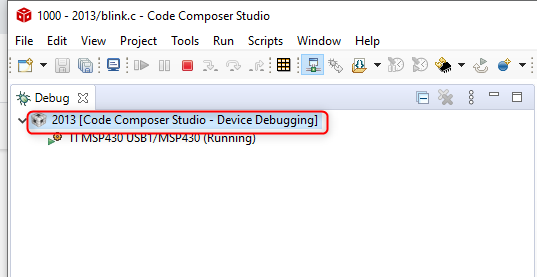
If I send the program to the CPU I see the red button for terminate only. The Buttons for run, stop, go into, go over are gray and not usable.
The use of memory is: 31185 bytes of FRAM and 1335 bytes of RAM. It use the big FRAM as memory for measurement values.
#pragma NOINIT(name)
struct{
...
}name;
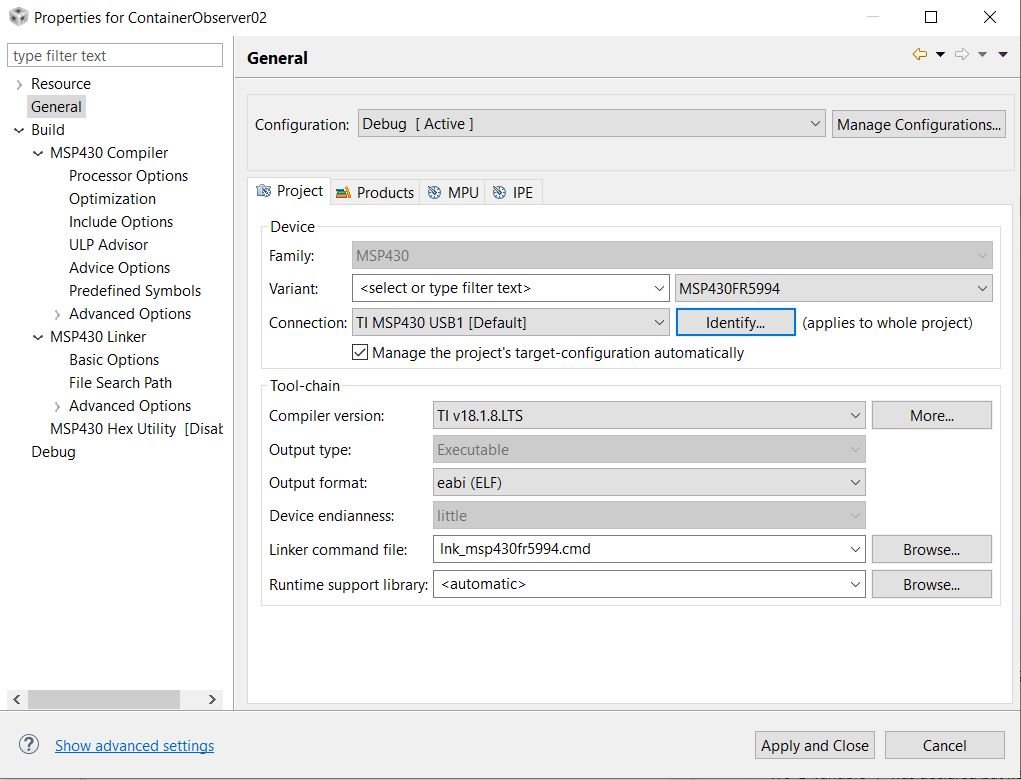
The compiler is TI v18.1.8.LTS.
I choosed this options:
Silicon version: mspx
code memory: large
data memory: large
must be far: none
What can be the problem for the not usebility of the debugger? Wich options I can try to solve this problem? Why I don't get error messages?
Best regards
Hardy Zissel