This thread has been locked.

If you have a related question, please click the "Ask a related question" button in the top right corner. The newly created question will be automatically linked to this question.

CCS/LAUNCHXL-CC1352R1: GEL Expressions during debugger loading.

Part Number: LAUNCHXL-CC1352R1
Other Parts Discussed in Thread: UNIFLASH

Tool/software: Code Composer Studio

Hi!

Environment:

CC1352R1 HW Rev. B.
CCS 10
SDK 4.20.00.35

Problem:

Recently I realized that when I start debugging my program it has two more steps that taking long time: 

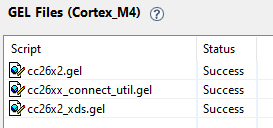
GEL Expression: OnFileLoaded(0, 0, 0) - sometimes it's OnFileLoaded(0, 1, 0)
GEL Expression: 16-0x10

What is it for? Can I disable or do something to short time during these expressions? 

Robert.

  • Hi Robert.

    I believe the cc1352 uses the cc26x2.gel startup GEL file. When looking at this file, I see the below:

    OnFileLoaded(int nErrorCode, int bSymbolsOnly)
    {
        if (bSymbolsOnly == 0)
        {
            LoadRomSymbols();
        }
    }
    
    
    menuitem "CC13x2_CC26x2"
    hotmenu LoadRomSymbols()
    {
        if(GEL_IsConnected() == 1)
        {
            if(_deviceId == -1)
            {
                // Read from device
                _deviceId = HWREG(FCFG1_ICEPICK_DEVICE_ID);
            }
    
            if(IsCC13x2CC26x2())
            {
                if(IsCC13x2CC26x2Rev2())
                {
                    GEL_SymbolAdd("$(GEL_file_dir)/images/cc26xx/cc26x2r1f_rtos_rom_syms.out");
                    GEL_SymbolAdd("$(GEL_file_dir)/images/cc26xx/cc26x2r1f_driverlib_rom_syms.out");
                }
                else
                {
                    GEL_SymbolAdd("$(GEL_file_dir)/images/cc26xx/cc26x2r1f_rtos_rom_syms_rev1.out");
                }
            }
            else
            {
                GEL_TextOut("Device not recognized as CC13x2 or CC26x2. No symbols loaded.\n");
            }
        }
        else
        {
            GEL_TextOut("No symbols loaded (not connected to target).\n");
        }
    }

    Assuming you are using rev2 of the device, it looks like it is loading some additional symbols.

    It shouldn't take that long of a time. What kind of delay are you seeing?

    Thanks

    ki

  • After some research here are my results:

    Sequence of debugging is like this (with ~time that take every step, screenshots are attached at bottom):

    1. Loading 'program.out' - 5 sec
    2. Loading Symbols 'program.out ' - 15 sec
    3. GEL Expression OnFileLoaded(0, 0, 0) - 25 sec, and during the same time:
      1. Loading Symbols cc26x2r1f_rtos_rom_syms.out
      2. Loading Symbols cc26x2r1f_driverlib_rom_syms.out
    4. something like pause? (nothing in Progress View) - 30 sec
    5. GEL Expression OnFileLoaded(0, 1, 0) - 10 sec

    And at this point I though that maybe reset flash memory will help, so I did it with UniFlash. After entire flash memory erase sequence is the same but take only 5-10 sec, unfortunately when program is loaded and stopped at main I have to wait 1-2 minutes to CCS unfreeze and be responsible again (so finally this take the same amount of time).

    GEL files:

    Sequence (1-5)

  • Robert Galon said:
    • GEL Expression OnFileLoaded(0, 0, 0) - 25 sec, and during the same time:
      1. Loading Symbols cc26x2r1f_rtos_rom_syms.out
      2. Loading Symbols cc26x2r1f_driverlib_rom_syms.out
    • something like pause? (nothing in Progress View) - 30 sec
    • GEL Expression OnFileLoaded(0, 1, 0) - 10 sec

    That is too long. It loads the symbols much quicker in my environment (a few seconds). Do you have a heavy workspace (lots of large open projects)? Perhaps there are some other background tasks running (like the indexer). You can try cleaning your workspace or disabling the indexer to see if that speeds things up.

    Also, try a manual launch and then manually connect and load your out file. See if the performance is any better

    ki

  • Here are my results:

    1. After closing other projects, open CCS with -clean flag, cleaning up my workspace or creating new one nothing changed.

    2. When I divide debugging process to flash and then manually connect debugger everything works better, but still it's not perfect (flashing is fast, but loading symbols taking ~1 - 1.5 minute). I can say that total time is like two times shorter.

    3. I can see dependence between size of my project and total connecting time, it's like increases linearly.

    4. When I'm using UniFlash program flashing is taking less time ('loading symbols' window during flashing is absent), but loading symbols when connecting debugger is still taking same time.

    Flashing and connecting debugger separately is fine, but is any way I can decrease loading time even more?

  • Symbol loading should be one of the quicker actions, especially compared to flashing. 

    Can you provide the symbol file? If you do not wish to share it publicly on this forum, please start a private e2e conversation with me

    Thanks

    ki

  • Hi Ki,

    We decided to split this thread up into two separate.
    We extracted the part concerning only the symbols loading process to the new thread
    e2e.ti.com/.../3440848

    The rest of the whole automatic debugging process stays in this original thread.
    We don't really know if the rest of this process makes any problem.

    Regards

    Adam

  • Can you enable debug server logging and the reproduce the issue? Then disable logging and zip up the log (it compresses well) and attach the zip to this thread.

    Thanks

    ki

  • Hi Ki,

    I sent you packed logs in private message, hope it'll help.

  • Hi Ki,

    did You find data I sent helpful? When can we count on any feedback?