This thread has been locked.

If you have a related question, please click the "Ask a related question" button in the top right corner. The newly created question will be automatically linked to this question.

CCS/66AK2G12: Statistical Function Profiling with Blackhawk USB560-V2 Not Producing Data from C66xx Target

Part Number: 66AK2G12

Tool/software: Code Composer Studio

I am using CCS Version 8.3.1.00004

I am using a Blackhawk USB560-V2 System Trace Probe.

Our target is a 66AK2G12.

I have code running on both the ARM and the C66xx and I wish to perform statistical function profiling with CCS on the C66xx.   

I have followed the manual guidance to start Statistical Function Profiling under the Tools/Hardware Trace Analyzer.  However, while the session appears to start no data is being produced.  See the screen shot below.   The code on the C66xx was running when I started the Profiler but I assume that is OK.

Any help would be appreciated.   Thanks.

Some Trace configuration screen shots are below:

  • Hello,

    The links to the screenshots are broken. Can you re-post?

    If you are still having issues posting it, please see the below FAQ:

    https://e2e.ti.com/support/tools/ccs/f/81/t/821597

    Thanks

    ki

  • It is working for me now.  My misunderstanding was that the Statistical Function Profiling tab doesn't show the start/stop button so I assumed it would automatically refresh the display.  Once I discovered that I needed to use the stop button from the Trace Viewer tab, it worked.   As soon as I stopped the Trace, the Statistical Profile results were available.

    Is there any way to have the results automatically refresh without stopping the trace?

    Are there configuration items that affect the efficiency of each sample?   My Blackhawk USB560-V2 seems to only work with ETB which appears to not be able to actually capture much of a statistical profile due to its small buffer.  

  • Richard Young said:
    Is there any way to have the results automatically refresh without stopping the trace?

    Not when using ETB. The target will need to be halted to pull the trace data from the ETB.

    Richard Young said:
    My Blackhawk USB560-V2 seems to only work with ETB which appears to not be able to actually capture much of a statistical profile due to its small buffer.  

    Yes, that is the main limitation of the ETB vs Pro Trace

    Richard Young said:
    Are there configuration items that affect the efficiency of each sample?


    Yes you can configure the trace session with a variety of triggers so that only the relevant data is captured. Please see the below old (but still relevant)  presentation for some more information on PC Trace:

    http://software-dl.ti.com/ccs/esd/training/modules/trace_keystone/CCSv6-KeystoneTraceWorkshop.pptx

  • Hi Ki

    Thanks for the answers so far.   As my interest is to get some reasonably accurate function/thread/CPU load profiling within a rather large DSP application, I think my ETB-only BlackHawk emulator is not going to do the job.  

    I've moved on to looking into using ROV which I understand makes use of facilities within SYS/BIOS to provide overall CPU loading and thread profiling data.   This info would serve me well.   

    However, I have not yet been able to get ROV to work with my code.   When I tried this, while I was successfully connected to my target and the images loaded and running, I was unable to successful connect with ROV.  I perused the forum for ROV not connect and found the following thread

    https://e2e.ti.com/support/processors/f/791/t/903050?tisearch=e2e-quicksearch&keymatch=ROV%20not%20connect

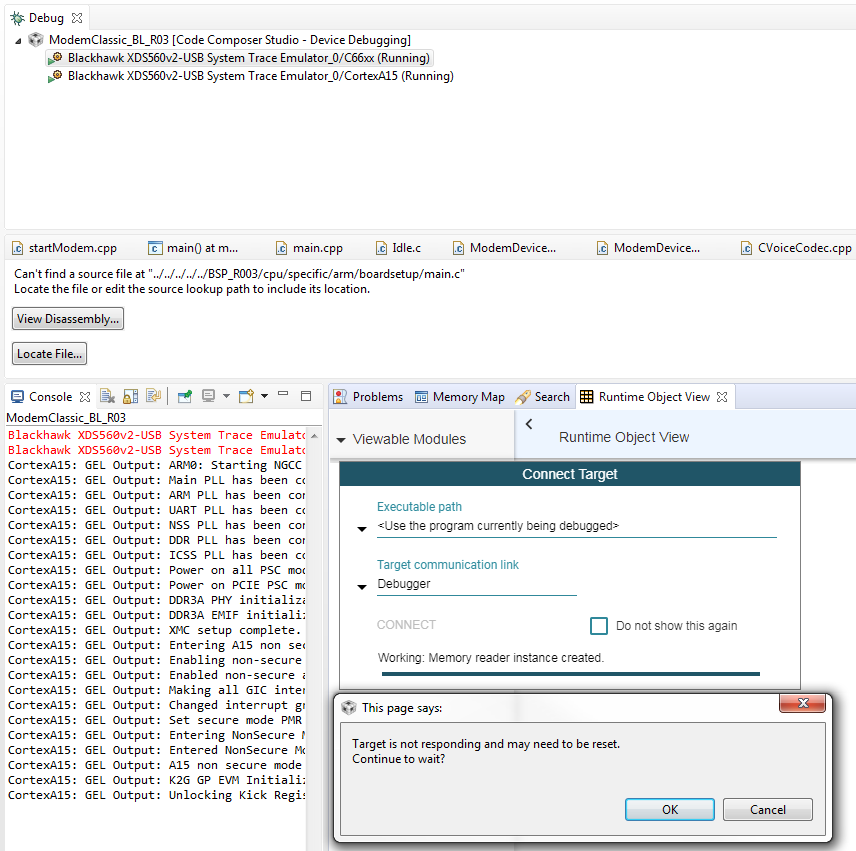
    The picture in this thread that shows the message Target Not Responding and May Need to be Reset is what I am getting.   The end of this thread mentions a bug that Internal teams confirmed and can reproduce.   It is not clear if this is my issue or not.   Do you have any suggestions?  Could I be failing to do some other important step?

    I am developing on a 66AK2G12 SoC.  Compiler version is v8.2.7.   CCS Version: 8.3.1.00004.

    Below is a screen shot of my attempt to connect to ROV.

  • Hi Richard,

    I had split your previous post to a new thread since it was covering a new topic (ROV):

    https://e2e.ti.com/support/tools/ccs/f/81/p/933120/3446889#3446889

    It has been assigned to the TI-RTOS experts. Please see Todd's follow up questions.

    I had previous tagged this thread as "answered" since the original question regarding hardware trace analyzer had been answered. I will tag it again. Please post any follow up questions regarding ROV in the other thread I mentioned.

    Thanks

    ki