Hi,
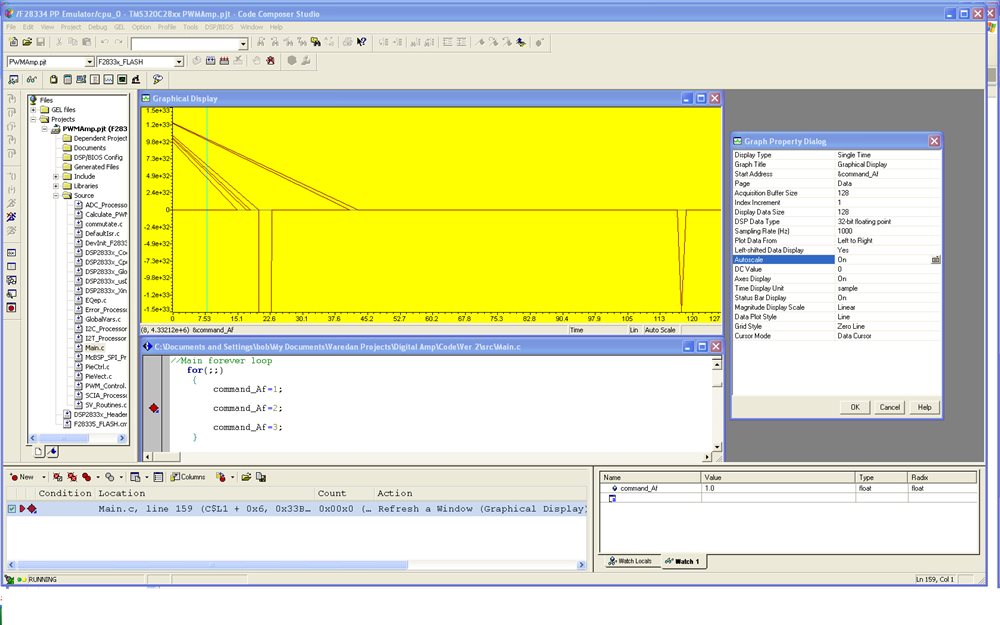
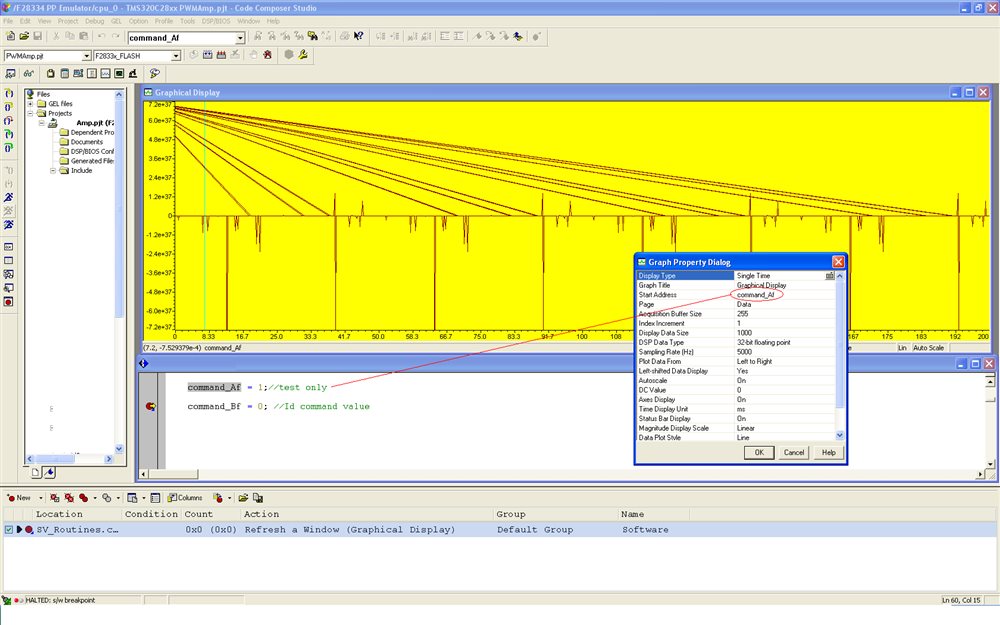
I'm having a problem using the graphical display feature of CCS3.3. As a test to learn this function, I set up a fixed value variable and tried to graph it. No matter what type of value I use (float, int, uint) all I get on the display is garbage. The variable that I'm using is set to a constant value yet the graph shows data all over the place. In the screen shown below, the graphed value (command_Af) is a float set to 1. I verified it's actually 1 at the breakpoint using the watchwindow. I've tried various combinations of Buffer size, sample rate, and Display data size with no luck.
Any ideas of what could be wrong?
Thanks.