Hi,
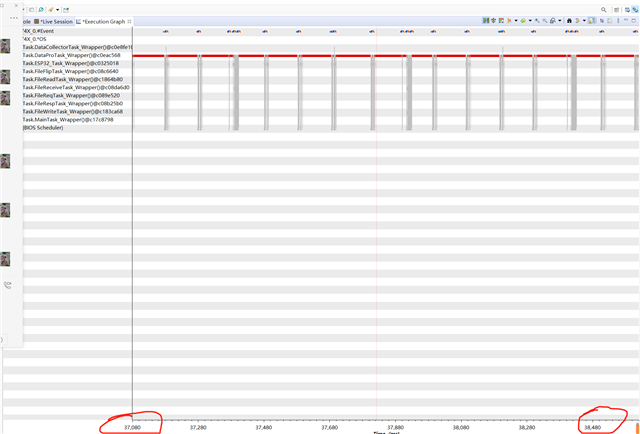
Below shows the execution graph in my CCS when I was debugging the program.
The Execution Graph shows a time range from 37080ms to 38480ms, so a time range of 1.4s.
How to extend the time range to monitor a long time, for example 10s.
Thank you.
This thread has been locked.
If you have a related question, please click the "Ask a related question" button in the top right corner. The newly created question will be automatically linked to this question.
Hi,
Below shows the execution graph in my CCS when I was debugging the program.
The Execution Graph shows a time range from 37080ms to 38480ms, so a time range of 1.4s.
How to extend the time range to monitor a long time, for example 10s.
Thank you.

Hello,
It could be that the display is only showing a small section of the captured data. If you use the option to zoom out (using the zoom out button on the toolbar or CTRL and "-" keys), you may be able to see a larger range of data.
Thanks
ki
It could be that the log buffer size is too small:
Thanks
ki