This thread has been locked.

If you have a related question, please click the "Ask a related question" button in the top right corner. The newly created question will be automatically linked to this question.

PSPICE-FOR-TI: Monte carlo resistor tolerances are not falling within specified

Part Number: PSPICE-FOR-TI

Hi,

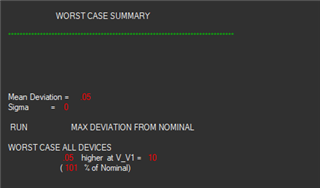
I'm using PSPICE for TI tool and running worse case & monte carlo analysis. Worst case analysis works fine, but monte carlo is erratic.

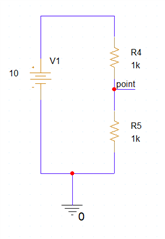
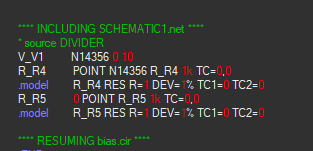
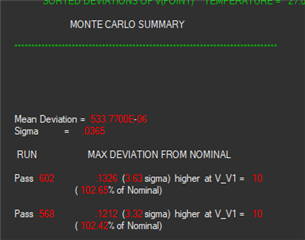
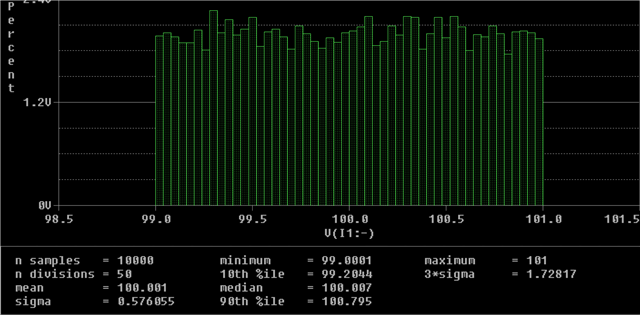
I tried with simple voltage divider circuit and found that monte carlo is assigning tolerance values for resistors outside the range of specified tolerances (in my case 1%). 

Steps I followed to run monte carlo:

1. Assigned 1% tolerances in resistors using edit properties

2. Pspice --> Edit sim profile --> Analysis type (Time domain)

3. Enabled general settings --> Enabled SKIPBP

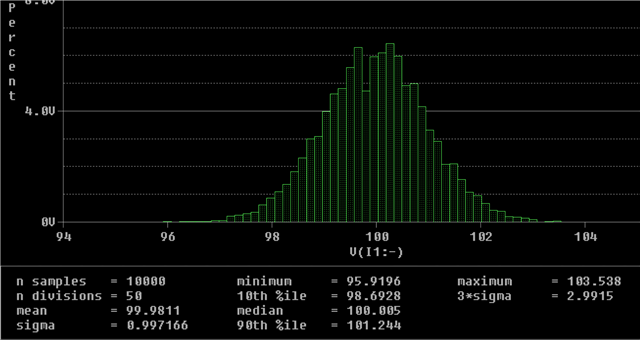
4. Enabled Montecarlo/Worstcase --> Added output variable --> Number of runs 500 --> user distribution : Guassian --> Random seed number :100 

5. Run --> seeing results in probe window & parameters 

I hope the steps followed are correct. Is this the bug in the tool or am I missing something?

  • Hi Zhu, 

    Thanks for the reply. Yes, I did watch and followed as mentioned. 

    Resistor model parameters: 1% defined for both resistors

    Worst case results: 1% is the deviation and that's true 

    Montecarlo results: 2.65% deviation observed & it's not possible.

    I saved the parameters and tried to look into it. Pass 602 data is here

        R4                                      R5

    9.72158e-01          1.02511e+00          

    Can clearly see, monte carlo is assigned tol of R4 to 2.28% & R5 to 2.5%. This is outside of limits specified. 

    Regards,

    Jaikumar M

  • Hi Jaikumar,

    Please make sure that you selected uniform distribution in your sim profile. Gaussian is not bounded.

    This is a uniform distribution on a component with 1% tolerance. As you can see, all the samples fall inside [-1%, +1%} of the nominal value:

    This is the Gaussian distribution on a component with 1% tolerance. In other words, 1 sigma is 1% of the nominal value. As you can see in this histogram, some samples fall out of the +/- 3 sigma limits. This is expected with a Gaussian distribution:

    Thanks,
    JC