Pspice for Ti for Monte Carlo analysis
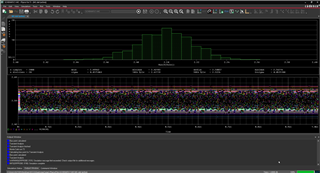
Why does the result of Monte Carlo analysis exceed the worst case value of the worst case analysis ?
Why do the maximum and minimum boundary values exceed the worst-case results?


This thread has been locked.
If you have a related question, please click the "Ask a related question" button in the top right corner. The newly created question will be automatically linked to this question.
Pspice for Ti for Monte Carlo analysis
Why does the result of Monte Carlo analysis exceed the worst case value of the worst case analysis ?
Why do the maximum and minimum boundary values exceed the worst-case results?


Hi Xinchao,
Please share your .mcp file for this run. Or feel free to archive and share the entire project.
Thank you,
Jackie
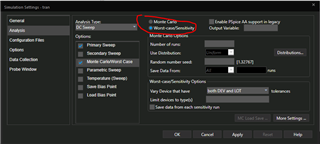
Do you mean the values provided by the worst-case sensitivity simulation run:

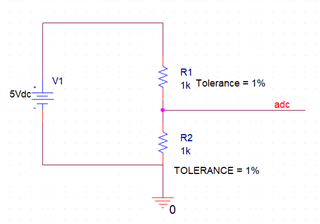
or do you just mean the max/min boundaries of the tolerances defined in the simulation (in your example, you were expecting to see 990 < R <1010) ?
Hello,Jackie:
Question1 : I think my question is the same as the connection question, but I hope to get a clearer answer. Why do we have to choose uniform distribution ? I think Gaussian distribution is more suitable for our practical application ,why does Gauss distribution lead to Monte Carlo analysis results out of range in Pspice for TI simulation ?
Question 2: Does Pspice for TI only include PSpice A / D? Is it different from the results of Pspice A/A?
Hi Xinchao,
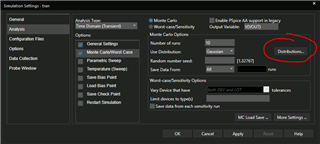
1. A Gaussian distribution is inherently unbounded. There is always a possibility for outliers, although they are unlikely. I have asked Cadence about their distribution. They reported that 75% of your results should fall within the bounds that you have defined. Uniform distribution was recommended in the other thread if hard boundaries are required. You can also experiment with defining your own distributions:

2. PSpice for TI does not include PSpice A/A, only A/D. The PSpice for TI A/D results should be identical to the commercial PSpice A/D. You are welcome to run PSpice A/A with the commercial Cadence SPB as well.
Thank you,
Jackie
Hello,Jackie:
Q1: However, if it is uniformly distributed, why the simulation results do show the results of Gaussian distribution (only different from the results of Gaussian distribution).
Q2:Sorry ,I I don't understand "75% of your results should fall within the bounds that you have defined" , that mean that the result of 3sigma can never be satisfied ?
Hi Xinchao,
1, You have two variations that are independent. While they are both uniformly distributed, the output distribution is determined by your circuit.
2, I think "75%" was a typo. Please share your project with us so we can give you a more accurate explaination.
Thanks,
JC