Because of the holidays, TI E2E™ design support forum responses will be delayed from Dec. 25 through Jan. 2. Thank you for your patience.

This thread has been locked.

If you have a related question, please click the "Ask a related question" button in the top right corner. The newly created question will be automatically linked to this question.

PSPICE-FOR-TI: How to display graphs on PSPICE-FOR-TI

Guru 10050 points
Part Number: PSPICE-FOR-TI

Hi,

Q1
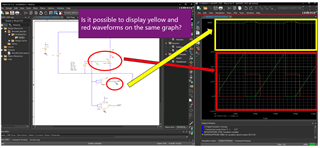
Is it possible to display yellow and red waveforms on the same graph? When simulating logic IC and analog, is the logic IC output displayed separately from the analog output?
Q2
Related to Q1. The output of the logic IC is displayed in a separate frame from the analog plot area. Is this a logic time chart? Also, the trailing edge is yellow, but what does that mean?

Q3
Q1 is running with NAND, but I can't simulate if I set it to NOR. Please tell me what to do. ERROR(ORPSIM-15461): Incorrect number of interface nodes for X_U13.

Thanks,

Conor

  • Hi Conor,

    The digital signals are on a separate graph as they don't have the same y-axis "scale" as the analog signals.

    you can try removing unused libraries from your sim profile to see if you can simulate with the NOR. it is possible that some models used the same name and a conflict was caused.

    -JC