This thread has been locked.

If you have a related question, please click the "Ask a related question" button in the top right corner. The newly created question will be automatically linked to this question.

TIDA-00663: Time1 < Time2 issue

Part Number: TIDA-00663
Other Parts Discussed in Thread: TDC7200, , TDC7201

Hi All,

I've been trying to understand how it is possible that the time registers Time1 and Time2 sometimes returns values where Time1 < Time2 resulting in incorrect calculations.

I'm checking the MEAS_COMPLETE_FLAG for both TDC's but now also if Time1 < Time2 for both as workaround.

If one of these faulty conditions occur I disable/enable the TDC's to reset them.

I also noted an asymmetric behaviour of the INTB outputs: is this normal?

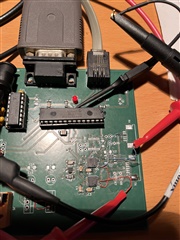
I suppose the start/stop pulses are within spec as shown in the scope pictures.

Anyone a clue??

Groeten.

  • Hello, please let me check to have the right engineer to support you on this topic.

  • Hello Denge,

    Thanks for posting to the E2E forum. It looks like the scope capture you mentioned above was not attached.

    Also can you further explain what you mean by asymmetric INTB behavior?

    I am not super familiar with the reference design mentioned here but if there are questions regarding the TDC7200 I can definitely help you get those figured out.

    Best,

    Isaac

  • Hello Isaac,

    Correct, the attachments were not added for some reason.  I hope his time it will work.  Some clarification:

    the yellow trace is the stop pulse of the 1e TDC and the cyan trace the stop pulse of the second TDC.  The magenta pulse is the start pulse for both.

    The asymmetric behaviour of the INTB signals is best explained in the trace green / magenta.  Here magenta corresponds to the yellow pulse and green to the cyan one.

    I'm still encountering T1 < T2 on one or both TDC's without any obvious causetek00005.tiftek00004.tif

  • Hello Denge, 

    Thanks for the scope captures and the clarification. I can see what you mean regarding the asymmetrical INTB pulses. I know you included the the reference START pulse for both the TDC's in one of the captures but is it possible to measure the START pulse near each pin if not on each pin of the device? My concern is that perhaps there is some board parasitic that are causing a delay on one of the signals. Some questions on my end:

    Is the schematic the same as TIDA-00663? Was the same board layout used?

    Is it also possible to provide the device configurations for each of the TDCs? and result registers for each one of the devices?

    On another note, we do offer the TDC7201 which integrates two TDC7200s together.

    Best,

    Isaac

  •  Hello Isaac,

    The start pulse on the pin is very steady as you see in the green trace.  This one is generated by the processor while the stop signals are generated by a two channel AFG and fed, into the board by (quite cheap) cables. 

    The schematic is based on the TIDA-00663 but for now stripped down to the processor (DSPic33), 2 times TDC7200, a SiT2024 (16 MHz oscillator) plus the decoupling caps.

    I've also been digging into the firmware but can't find any strange things causing the T1 < T2.

    Each new measurement starts with writing 0b00000011 to the config 1 register to put both TDC in mode 2 and start the measurement, config register 2 stays default on all 0's.

    The results are the following:

    StatusTdc2  00011001
    StatusTdc1  00011001
    Result1  89.82031250000000000
    Result2  139.8593750000000000
    Result3  50.03906250000000000
    Time1Tdc1  1163
    Time2Tdc1  669
    CalReg1Tdc1  1314
    CalReg2Tdc1  13104
    CalReg1Tdc2  1286
    ClkCnt1Tdc1  14
    ClkCnt1Tdc2  22
    Time1Tdc2  1137
    Time2Tdc2  566
    CalReg1 1286
    CalReg2Tdc2  14899
    ErrorCount  0x3F68

    tek00007.tif

  • Hello Denge,

    Thanks for the info please let me review the information and get back to you.

    Best,

    Isaac

  • Hi Isaac,

    I've some additional information: I added two 16-bit counters counting the T1 < T2 events for both TDC's and plotted the results (see screenshot).

    The op trace is the delay between stop TDC1 and TDC2 going from 50 ns to 1.8 µs.  The bottom traces are both error counters, wrapping around when reaching 0xFFFF.  What is strange is that the slope of the graph is steady when the delta time is steady but increases when changing this time.

    I still have no idea why this situation is occurring.

  • Hello Denge,

    Thanks for the plot. I am not sure if I understand that the upper graph means here, is this what you mention to be the delay between TDC1 and TDC2? It seems like this error is continuously happening since your error counters essentially look like a pretty steady sawtooth. I still have not had a chance to look at your results to see if I can spot an issue there.

    It seems like you did not provide the configuration for each TDC though, do you know what each device is configured to mainly looking at the CONFIG1 and CONFIG2 registers here to make sure the settings match.

    Best,

    Isaac

  • Hi Isaac,

    You understood it correctly regarding he upper plot.  It is indeed the time delay between the two stop pulses of both TDC's.

    The setup of both config registers is for both the same: each measurement starts with writing a 0b00000011 to CONFIG1 register (mode 2 + setting the start measurement) while CONFIG2 register is left to it's reset state being 0b0100000.

    The error occurs indeed in a steady manner!  I added a new plot with the successful measurements and this reveal that only one out of four measurement is correct...

    Groeten,

    Hans

  • Hello Hans,

    It seems like there is a bit missing for your config2 register settings you provided. Besides that I am not sure if your configuration is correct. The reason I say that is due to the results that you provided above, you pointed out that there were results for Time1 & Time2 for both TDC's. Meaning that the device is configured to detect two STOP pulses hence why it generated the extra TimeX values for each device.

    On another note, in the results you provided TDC2 has a higher Clock_Count than TDC1 meaning that this is a valid scenario where the time of that pulse 2 is further away in time than pulse 1. If you are using only the TimeX registers for the ToF comparison you will yield incorrect results when configured to mode 2. Keep in mind that in mode 2 the TimeX registers are used to keep track of smaller fragments of time while the Clock_CountX registers keep track of larger segments of time. When the time is too large for the coarse counter (meaning before it overflows) it will use the Clock counter to keep track of the larger segments.

    Since you are operating in measurement mode 2 please be sure to use the formula found in section 8.4.2.2.1 of the datasheet to calculate the ToF of the pulse where it takes the TimeX and Clock_CounterX time into consideration. If you are not expecting two pulses at the input of each device be sure to change the configuration to only a single pulse for each device.

    I hope this helps let me know if there are any questions!

    Best,

    Isaac

  • Hi Isaac,

    It was a typo for the CONFIG2 register.  CONFIG2stays in it's reset state 0b0100 0000 so 10 clock periods calibration, 1 measurement cycle and Single stop.  So this should be OK, correct?

    I'm indeed using the formulas from section 8.4.2.2.1 and the results -when correct- are pretty close to the delay I set on the AFG.  The only thing that keeps bothering me is the question why the results for the time registers are so frequently wrong.  I added another plot with the time registers 1 & 2 of both TDC's and I guess they speak for themselves. from the bottom traces where 1 is a negative result for T1-T2.

    The SPI clock is 10MHz so within spec.  The reading are only done when both INTB signals are low...

    A question: is it useful to reset the TDC's by pulling the ENABLE pin low after such error?

    Good weekend,

    Hans

  • Hello Hans,

    So for a typical measurement are you only getting one set of results for the TimeX registers? If you are configured to 1 expected STOP pulse then you should not be reading more than 1 result from these registers.

    Can you provide me a set of data for bad measurement on both TDC1 and TDC2 as well as what time you have configured on the AFG to see if we can somehow correlate what your reading out of the device? Also provide me your calculation for ToF to ensure if its being performed correctly. Perhaps there could be an error in the processing that is yielding an incorrect result. I don't think you should be getting this level of errors from the device.

    Best,

    Isaac

  • Hi Isaac,

    I do not agree with you that only one time reading is sufficient when configured to 1 expected stop pulse in MODE2 seen the formula in 8.4.2.2.1 contains TIME1 and TIME2.  

    For the data set, what do you exactly mean?  A spreadsheet with the results from the time readings for example?

    The settings of the AFG are pulse burst, one  pulse on each channel with a width of 100 ns on each trigger, the time distance between the pulses is variable and the stop pulse of TDC1 always comes before the stop pulse of TDC2.

    I forgot to ask in previous conversation: do you see a similar spreading/fluctuation in the T1 and T2 values at your place or are they far less jumpy?

    I added the calculations in assembler written for a dsPic33EPxxxGPxxx microcontroller.   Note I rearranged the calculations from the formulas in 8.4.2.2.1 in order to obtain a better scaling.

    Groeten,

    HansMain.s

  • Hello Hans,

    The additional TIMEx readings are used to obtain the ToF between the first STOP pulse and the other multiple STOPs. If only configuring a single STOP value then only a single TIMEx value is required. Please view my real life example below of what the data provides when using the calculation as shown in the datasheet.

    In this example I set the device up to have a ToF STOP in ~0.5us. This is what I am reading from the device:

    TIME1 = 9238

    CALIBRATION1 = 2317

    CALIBRATION2 = 23156

    CLK_COUNT = 0

    TOF = normLSB (TIME1- TIMEn+1) +(CLOCK _COUNT)(CLOCKperiod)

    ToF = 0.0539853E-9*(9238) = 0.4987us 

    As expected I obtain ~0.5us.

    Now if I configure the device to accept two STOPs and add the other STOP pulse at 2.5us then

    TIME1 = 9239

    TIME2 = 46264

    CALIBRATION1 = 2317

    CALIBRATION2 = 23141

    CLK_COUNT = 0

    TOF =  0.0540242E-9*(9239-46264) +(CLOCK _COUNT)(CLOCKperiod)

    ToF = -2us

    The initial pulse occurred at 0.5us and the second pulse occurs at 2.5us, but if you notice including the extra TIME2 into the formula yields the time between the first STOP and the second STOP for a total of -2us. If you wanted the total time for TIME2 (from START to STOP2) then you would need to remove the usage of TIME1 in the equation along with the subtraction.

    To answer your question the measurements are not that jumpy on my end, they vary a slight but for example doing the 0.5us test I would read anywhere from 9232-9243 for the TIME1.

    For the dataset you can provide the same information like I provided above but for a bad reading to see if I can calculate this with you. I am not certain if the one you provided previously was a failed reading or not but it looks valid on my end. Also provide what your expected ToF result should be so that I can compare the answers.

    I hope the example I just covered helps!

    Best,

    Isaac

  • Hi Isaac,

    The calculation example you gave is at my humble opinion for the mode 1 while I set the TDC's here in mode 2 with a 16 MHz clock!

    I will try to run in mode1 -although the data sheet do not recommend it for measurements above 500 ns- and see what is happening than.

    The example calculations I based my program on is the following (page 18) in the datasheet:

    TOF1 (TIME1)(normLSB)+(CLOCK _ COUNT1)(CLOCKperiod)-(TIME2)(normLSB)

    Note the Clockperiod is in my case 62.5 µs.

    Groeten,

    Hans

    data.txt
    100ns width - 500 ns distance - no T2 - faulty
    StatusTdc2	00011001	
    StatusTdc1	00011001	
    Time1Tdc1	454	
    Time2Tdc1	1124	
    Time1Tdc2	450	
    Time2Tdc2	1040	
    CalReg1Tdc1	1097	
    CalReg2Tdc1	10948	
    CalReg1Tdc2	1086	
    CalReg2Tdc2	14899	
    ClkCnt1Tdc1	15	
    ClkCnt1Tdc2	23	
    Result3		49.24218750000000000	
    
    400ns width - 500 ns distance - no T2 - faulty				
    StatusTdc2	00011001	
    StatusTdc1	00011001	
    Time1Tdc1	240	
    Time2Tdc1	914	
    Time1Tdc2	238	
    Time2Tdc2	824	
    CalReg1Tdc1	1097	
    CalReg2Tdc1	10947	
    CalReg1Tdc2	1087	
    CalReg2Tdc2	14899	
    ClkCnt1Tdc1	15	
    ClkCnt1Tdc2	23	
    Result3	49.60156250000000000	
    
    400ns width - 500 ns distance - with T2 - faulty		
    StatusTdc2	00011001	
    StatusTdc1	00011001	
    Time1Tdc1	436	
    Time2Tdc1	1111	
    Time1Tdc2	432	
    Time2Tdc2	1024	
    CalReg1Tdc1	1100	
    CalReg2Tdc1	10972	
    CalReg1Tdc2	1089	
    CalReg2Tdc2	14899	
    ClkCnt1Tdc1	15	
    ClkCnt1Tdc2	23	
    Result3	8388552.953125000000	
    
    400ns width - 500 ns distance - with T2 - faulty	
    StatusTdc2	00011001	
    StatusTdc1	00011001	
    Time1Tdc1	212	
    Time2Tdc1	884	
    Time1Tdc2	210	
    Time2Tdc2	806	
    CalReg1Tdc1	1098	
    CalReg2Tdc1	10958	
    CalReg1Tdc2	1088	
    CalReg2Tdc2	14899	
    ClkCnt1Tdc1	15	
    ClkCnt1Tdc2	23	
    Result3		8388552.449218750000	
    
    400ns width - 500 ns distance - with T2 - correct
    StatusTdc2	00011001	
    StatusTdc1	00011001	
    Time1Tdc1	719	
    Time2Tdc1	297	
    Time1Tdc2	712	
    Time2Tdc2	216	
    CalReg1Tdc1	1098	
    CalReg2Tdc1	10953	
    CalReg1Tdc2	1088	
    CalReg2Tdc2	14899	
    ClkCnt1Tdc1	14	
    ClkCnt1Tdc2	22	
    Result3		49.61328125000000000	
    				

  • Hello Hans,

    Thanks for providing the data. Perhaps my formula worked because I am using a 8MHz clock so the division are not as fine as yours, so I was not reaching any clock counts due to the longer clock periods. Perhaps I might retry it with a longer time or a faster clock to match what you are getting on your end. One quick note is that clock period for a 16MHz clock is 62.5ns not us I am not sure if this affecting your calculations. You did not denote the SI prefix for your results so they could be off by a couple of factors of 10 if you are using microseconds in your calculations.

    I calculated all the info provided and I got approximately the 500ns for every calculation using the datasheet calculation on page 18. I am not sure if you are missing something in your program that is causing the calculations to be incorrect at times, such as examples 3 and 4.

    One question I had is that you noted the first two calculation as faulty even though the value is the same as the last calculation  which you denoted as correct, so I am just a little confused as to why these are labeled as incorrect. I attached an excel sheet where I calculated the third result where your program generated the result of: 8388552.449218750000 and my calculation (based on the values provided) generated 514ns.

    TDC7200 Calculations.xlsx

    Best,

    Isaac

  • Hi Isaac,

    The 62.5ns is indeed scaled to 6.25 sec in order to have a better scaling when calculating  the result in fixed point arithmetic.  As all calculations are unsigned only it explains why the wrongly results are way out of the 500 ns time difference but I'll revise my calculations to cope with these situations and look if the results are more consistent.

    I also noted that changing CALIBRATION2_PERIODS to 20 the flag MEAS_COMPLETE_FLAG is never set...


    Groeten,

    Hans

  • Hello Hans,

    Got it thanks for the information! Let me know if any more help is needed on the calculations.

    On the CALIBRATION2_PERIODS remark, I haven't observed this behavior before so I would need to test this out to confirm if this is the case.

    Best,

    Isaac

  • Hello Isaac,

    I changed all calculations to signed what sees to have solved the problemo of the calculations.  Did you had time to look into the CALIBRATION2_PERIODS behaviour?

    Yet another question:can you elaborate the sentence in the data sheet a little more as I don't understand how the chip it :

    "the TDC7200 will perform a series of measurements on its own" regarding the Multi-Cycle Averaging?

    Does it generates the start/stop signals by itself or does it issue an interrupt only after 16 times (for example) having seen the start/stop?

    Groeten,

    Hans

  • Hello Hans,

    I was able to test this and I was able to see the device respond properly with the MEASUREMENT_COMPLETE_FLAG at any of the CALIBRATION_2_PERIODS in which I configured the device into.

    Regarding your question on the multi-cycle averaging, the device will not perform measurements on its own. The device will output a trigger pulse after every single measurement is complete while expecting data until the value configured into the AVERAGING_CYCLES is reached. The device will take the average of all the measurements and output the data into the result registers. The INTB pin wont go low until the measurements are completed.

    So in your example the device will trigger 16 times and expect to see 16 START/STOP pulses before a the INTB pin goes low and the device will report the average of all 16 completed measurements. I hope this clarifies the behavior.

    Best,

    Isaac