Tool/software:
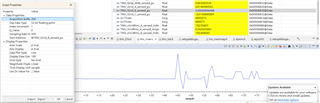
According to the Design Guide for TIDA-01606/F280039C, the oscilloscope waveform in Lab 2 is generated correctly. However, after setting up the Graph window in CCS, the displayed graph does not resemble a sinusoidal waveform. Instead, it updates approximately three times per second, making it difficult to observe the expected shape.
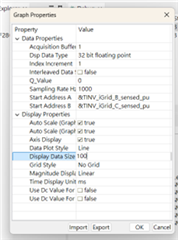
Could you advise on what might be incorrect in my settings?

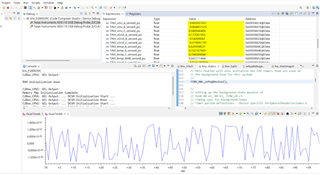
The image above is the example output provided in Lab 2.
Thanks.