This thread has been locked.

If you have a related question, please click the "Ask a related question" button in the top right corner. The newly created question will be automatically linked to this question.

TINA-TI Getting Started - Circuit or scope problems?

Other Parts Discussed in Thread: TINA-TI

I just downloaded TINA-TI and its Getting started guide. I entered the circuit schematic and tried the oscilloscope, but I can't seem to get any trace on the scope except sometimes a flat line. Since I followed the instructions quite carefully, I can conclude that I have 3 possible problems:

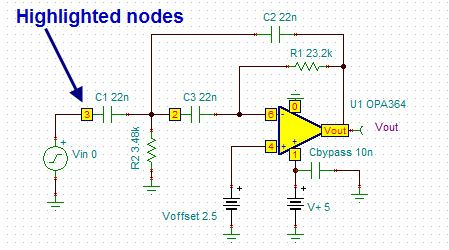
1) I didn't get the circuit connections that I needed. I don't know to verify this except by dragging wires a short distance to see whether other wires move.

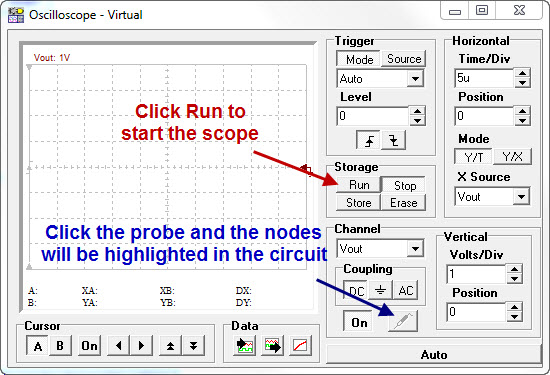
2) I don't know how to use the scope probe. When I touch a connection point with the arrow/finger cursor it changes to a wiring (pencil icon) and the wire drags on as I move the cursor into the scope display. (See page 9, "Place the cursor at the output of the simulated circuit,and adjust the controls in the virtual oscilloscope dialog box as needed
(step3)." This doesn't show what cursor is to be used, nor does it show the VM1 meter as selected. However the scope display does indicate VM1.

3) I have to somehow trigger a simulation to get the scope to display anything at all.

What can I do to find the problem?

Lou.

  • Some progress:

    1) I removed an extra wire, and corrected some reported wiring errors.

    2) Scope - still can't seem to get the scope probe concept.

    3) I now get a sine wave when I click the scope's Run button. Does it not display without sampling? - as a non-storage scope would? Isn't that what the "Auto" bar, at the bottom-right of the scope window, does?

  • Lou,

    The Oscilloscope can display any signal that you wish, however, you must use the Analysis ---> Options... Save all analysis option.

    Once this is set, you start the oscilliscope (T&M --> Oscilloscope) and click on Run. By default, the node marked with a Voltage meter will be displayed (if there is more than one meter, you can select them from the Channel drop down). If you click on the probe, the nodes in the circuit will be highlighted with yellow boxed numbers and you can click on any of thes nodes to display it.

    If you click on more than one node, they will all be displayed. You can turn them off by selecting the trace in the Channel pulldown and clicking the On toggle. If depressed, the On toggle will display the trace. If it is not depressed, the signal can be displayed by clicking on it. This allows the user to select all of the signals and switch between them during simulation without re-starting the run.

    Make sure to use a circuit that is suitable for continuous simulation. A SMPS startup curve that takes several minutes to complete would be better suited for use with the plotter, not the oscilloscope.

    Britt

  • Lou,

    I use & support TINA quite a bit, but have not used the scope feature much so you inquiry is a good learning opportunity.

    Before we get to the oscilloscope details, please note there are a number of example circuits built into TINA.

    if you select the menu item File/Open Examples a pop-up window shows a directory of application circuits in directories that begin with the title Cap Load Comp, and end with the folder titled WIDEBAND. The folder titles describe the application they support except for the folders TI Test Circuits and NSC Test Circuits. These two folders hold reference circuits for most of the TI device models that are in the TINA Spice Macro Library. The circuits in these two directories are pretty general and are oriented toward a particular device rather than an application. They can often serve as a good starting point if you want to build & simulate a circuit built around a particular device.

    The Wien Bridge Oscillator circuit in the TINA Quick Start Guide is available in two circuits in Examples/Oscillators folder.

    Building up the circuit is a great excercise, but to quicken the process I added an oscilloscope to the Examples circuit Wien-Bridge Oscillator started with PS.
    The text embedded i the schematic page gives an overview of the circuit. 

    Adding an oscilloscope window with the default settings to that schematic gave the following:

    So it was initialized to look at the traditional circuit output (VF1), but you can change it to display any metering point designated as an "Output".
    In this case, the node VF2 was the other option in the Oscope "Channel" field.

    Selecting the field Storage/Run made the display start updating, but the display was out-of-range. Changing the Vertical Volts/Division field from 1 to 5 brought the curve within range. You can add the other ouput metering points by selecting them via the Channel field and clicking the "On" button at the bottom of that scope section.

    The display below is the result of selecting Storage/Run and making
    Channel/VF1 = 5V/Div with the Position field = -7.5V
    Channel/VF2  = 1V/Div with Position = 2V

    Hope this helps. Please let me know if you have any questions.

    Regards,

    John


  • Thanks, John. I'll look into these examples. But I need some help with the details I posted.

  • Britt, Good response. I still have a few questions:

    1.  I selected the "Save all analysis results" option. I assume I have to perform an AC analysis, but of what kind - an AC Table of AC results?

    Once I did the Table of AC Results, I opened the scope and clicked Run, and then the probe button ( thanks for pointing out that button.) At last I could pick points to measure. So that works.

    2. Where is this documented, in a user guide? The application Help does not have this in an obvious place. There needs to be something more than the application Help.

  • Lou,

    When you hit Run on the Oscilloscope, it performs a transient analysis (time based). Oscilliscopes are time based where an AC analysis would be a frequency based measurement (like the Signal Analyzer) . You do not need to perform any kind of analysis before hitting the Run on the scope. Once you hit Run on the scope, the probe button should go active. Click on it and the nodes in the schematic should become active and you can then move the cursor to the circuit and click on the node of interest.

    Make sure that the circuit you are using is set up for a time based simulation (filters or average SMPS models would NOT be a good choice). If you are looking at an AC simulation, the Signal Analyzer should be used. For filters, simply click on start and it will draw the waveform on it's display. The filter examples can also be run in the scope, however, you wiill be looking at a transient output response of the filter (which is interesting, but may not be what you want...).

    Be sure to remember that the Diagram Window can be used for any of the functions you are needing. The only difference is that the diagram window is static while the T&M devices are continuous. Quite honestly, I do not use these tools other than for demonstration purposes. I do all of the waveform manipulation in the diagram window after a transient or AC run.

    Documentation is lacking and is geared toward the full version of TINA (the documentation is the same for both TINA-TI and TINA Industrial). For the T&M tools, the only documentation is under Help ---> Contents---> T&M.

    Britt