


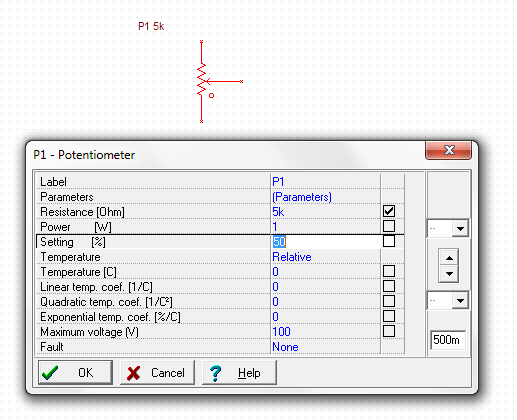
It's possible to plot gain vs frequency as the pot position is varied, but is there a way to plot the gain of a circuit vs the Setting % of the pot?
It's possible to plot gain vs frequency as the pot position is varied, but is there a way to plot the gain of a circuit vs the Setting % of the pot?


