This thread has been locked.

If you have a related question, please click the "Ask a related question" button in the top right corner. The newly created question will be automatically linked to this question.

Can we customize "Collect curves" and "Separate outputs"?

Other Parts Discussed in Thread: TINA-TI

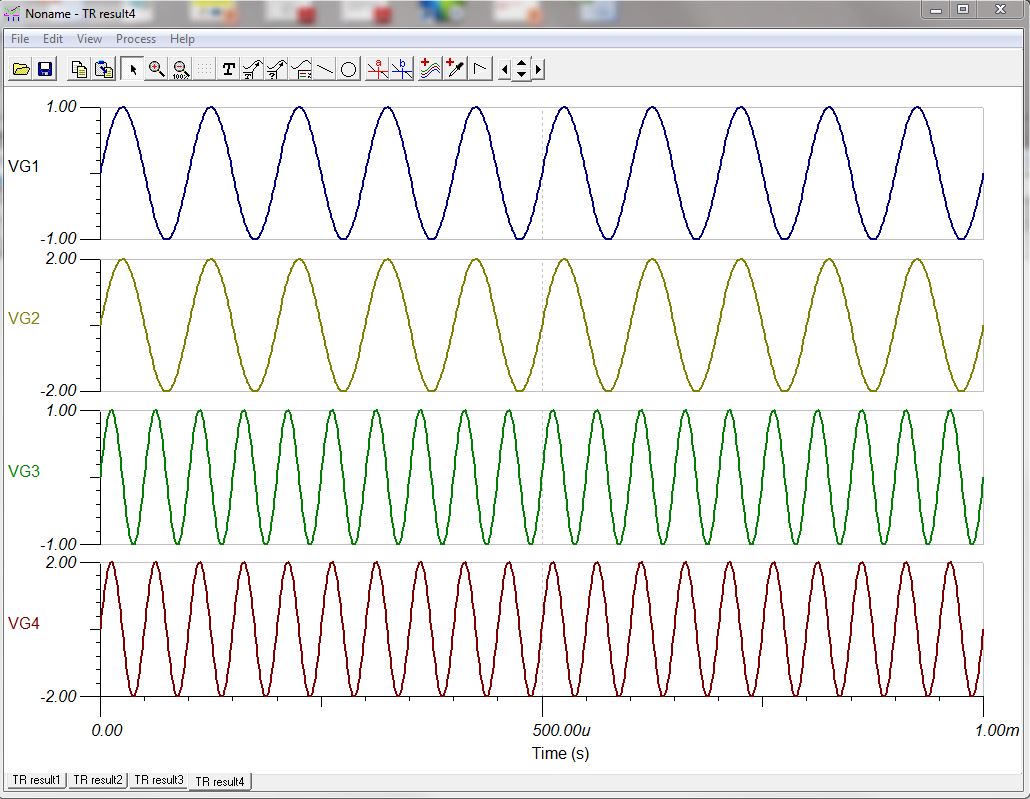
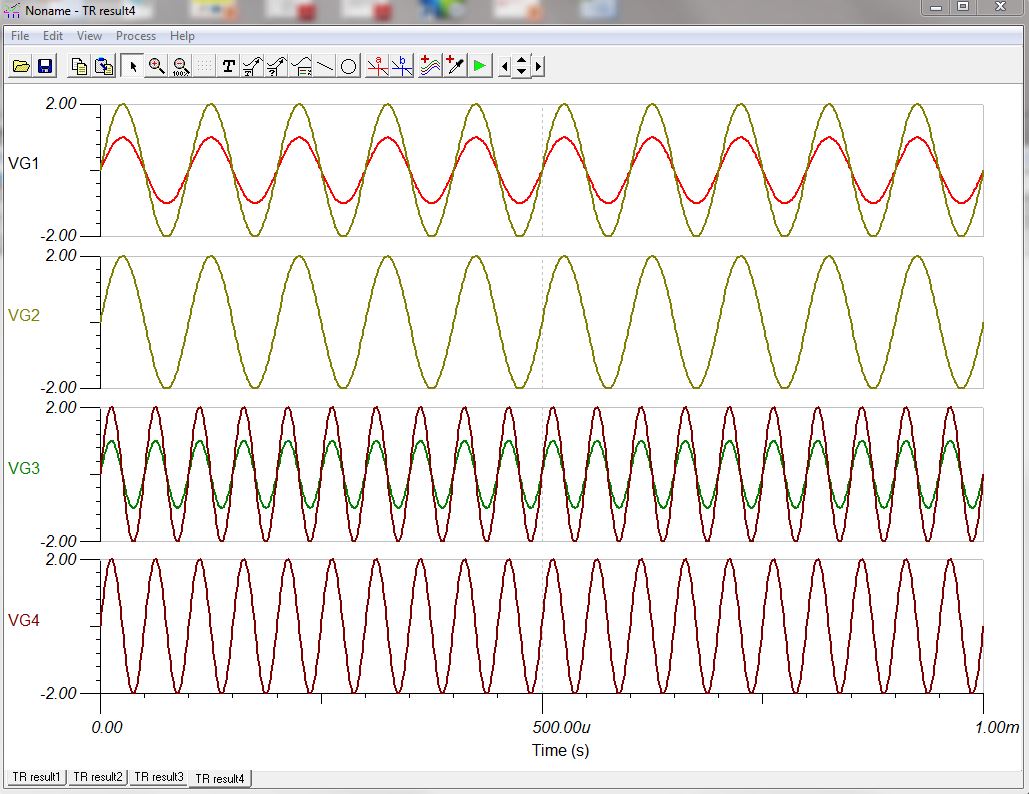
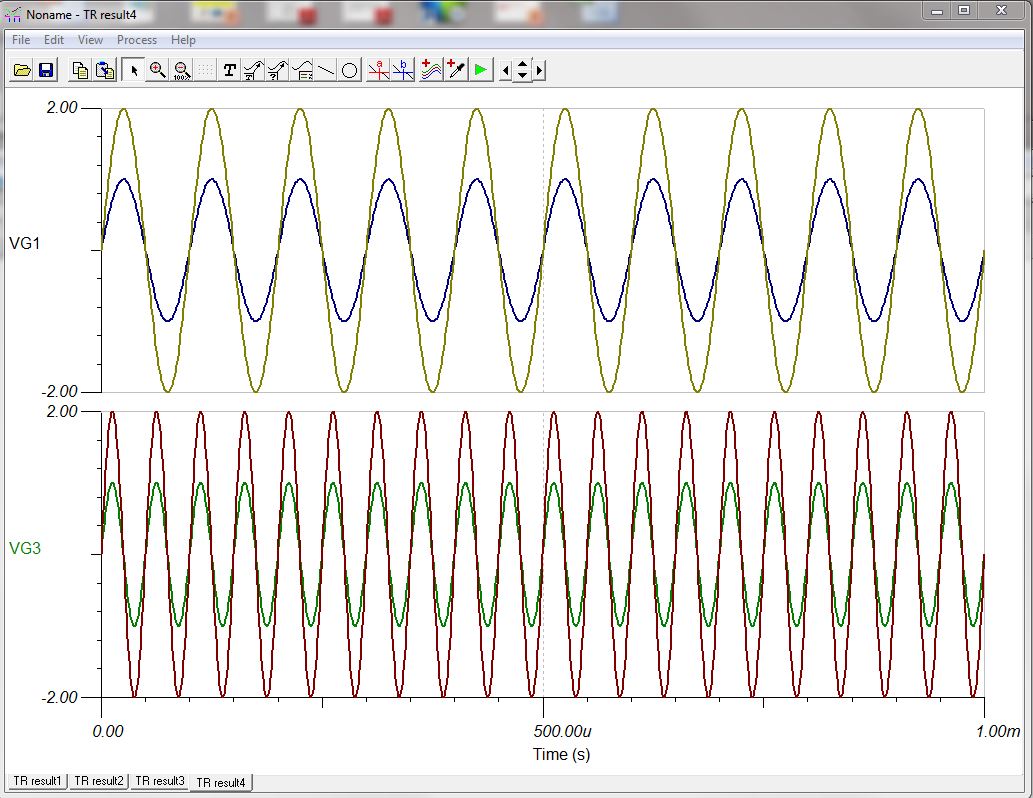
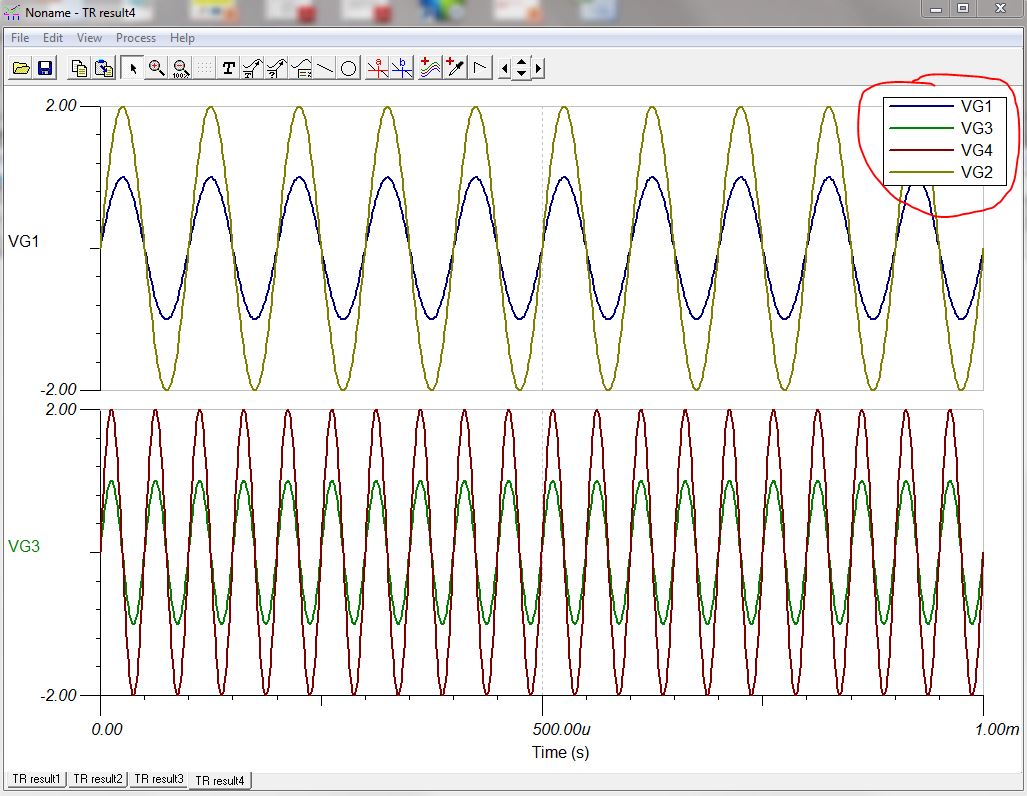
When plotting multiple curves in TINA, it's possible to select View -> "Separate curves" (For parameter sweeps) or "Separate outputs" (for multiple outputs) and "Collect curves" to put them all on the same axis again.  is there a way to collect only some of the curves on the same axis?  Like all the voltage curves on the same plot and all the current curves on the same plot, for instance?

  • Jonathan9420,

    I do not know of a way to customize the collect curves or separate curves commands in TINA-TI. These are generic built in functions. I believe that you may be able to accomplish part of what you are trying to do, however, by using the cut and paste capability of the Diagram window.

    If you run your simulation with all of the curves that you want and finish the simulation, you can then group curves into windows. Simply right click on the waveform you want to move and hit Ctrl-c. Next, select the curve you want to group with the first curve by right clicking on it. Hit Ctrl-v to paste it into the same window. Repeat the process until you have all of the curves you want together. To clean up the plot, delete all of the individual plots that you created. Here is a very simple example:

    Original plot with 4 waveforms after selecting separate curves. To automatically select separate curves, simply add a : to the name of one of your outputs.

    Next, cut and paste the waveforms for custom grouping:

    Next, delete the original signals that were pasted:

    Now, add the legend since the Y axis labels are not correct:

    Update the axis:

    And your custom plot is done. However, when you re-run the simulation, this will revert to the original format of the 4 waveforms (separated or collected, depending on how you first got the waveforms). You would have to do this each time you wanted to make the plot. You can always go back to the previous plot using the tab at the bottom of the diagram window and it will remain the same.