This thread has been locked.

If you have a related question, please click the "Ask a related question" button in the top right corner. The newly created question will be automatically linked to this question.

Can TINA-TI support to draw a continuous frequency spectrum of a certain signal under transient analysis ?

Other Parts Discussed in Thread: TINA-TI

Hi crews:

may I ask a question.

Can TINA-TI support to draw a continuous frequency spectrum of a certain signal under transient analysis ?

For example, I had ran a simulation with a signal Vout as shown below:

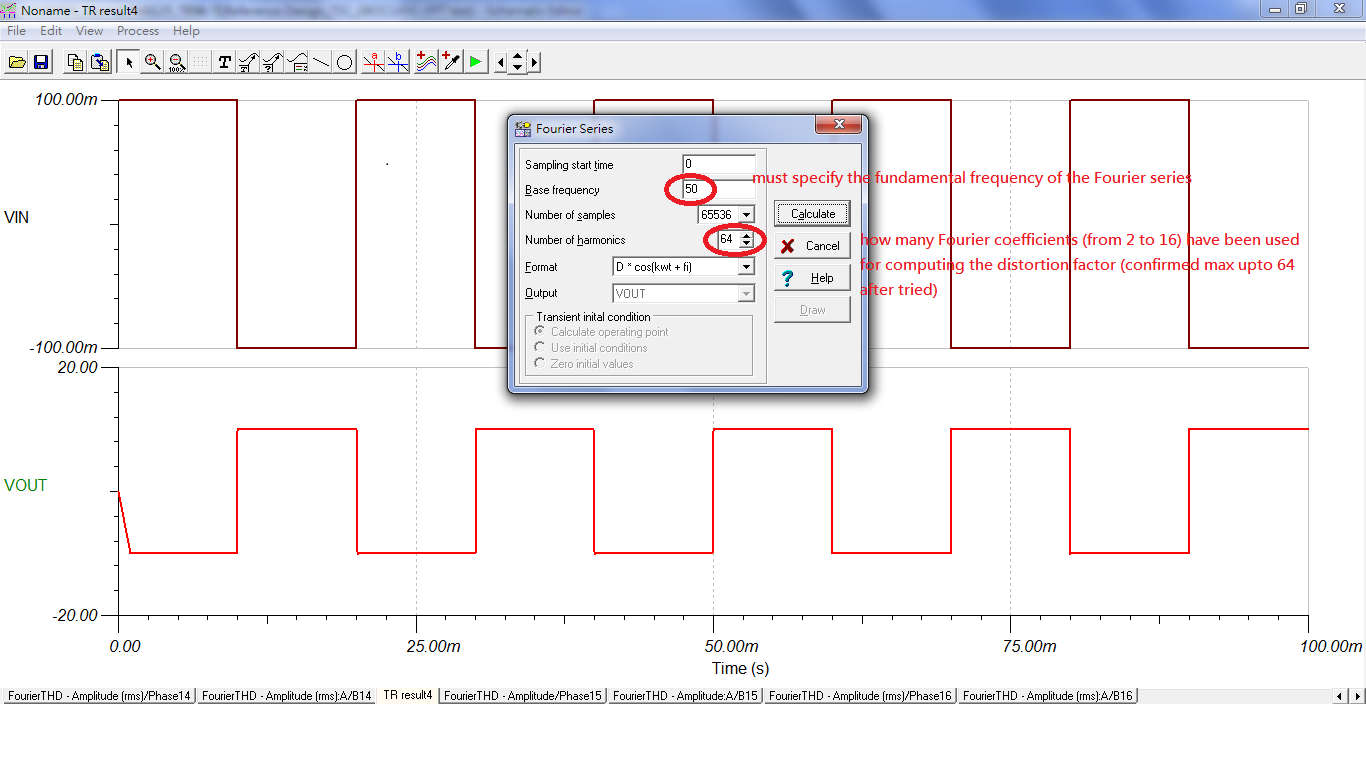
And then I ran "Process -> fourier series" in this waveplot window. After that it came out the result as shown below:

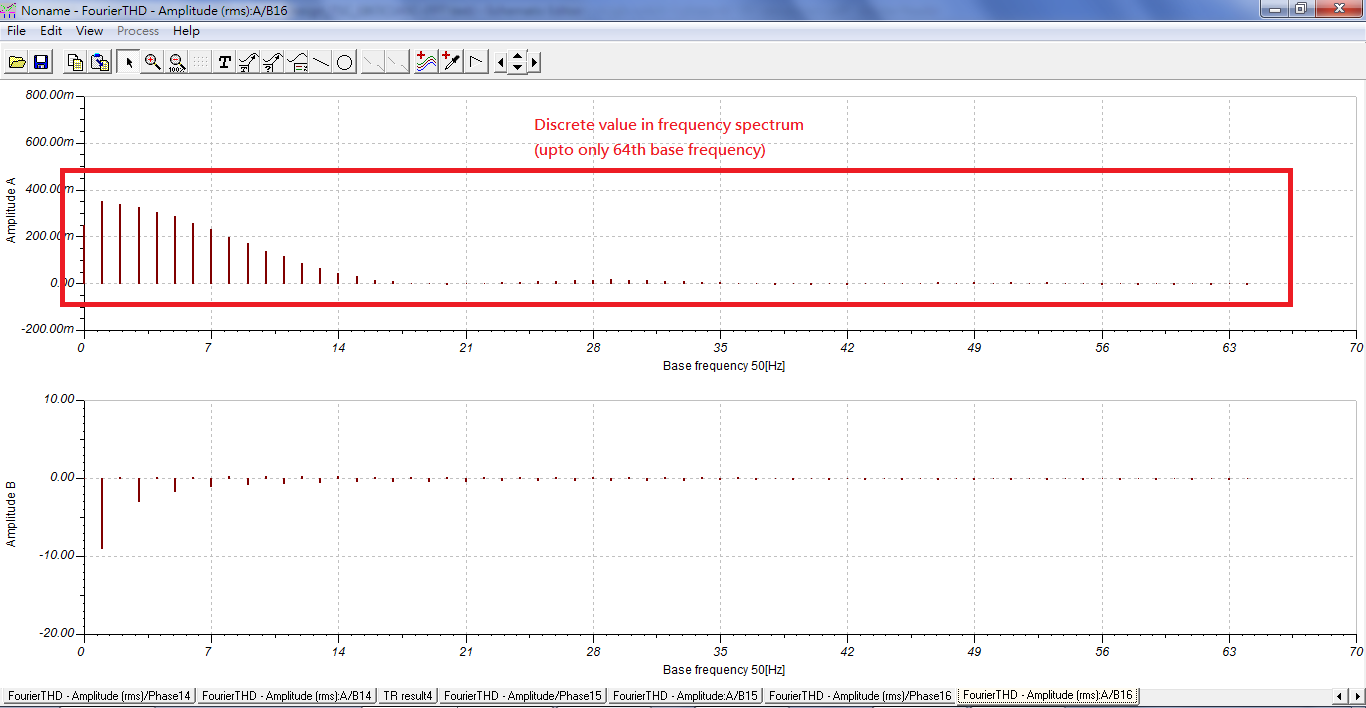
As you could see, there are some limitation exist in the function "fourier series".

1. max Fourier coefficients upto only 64th.

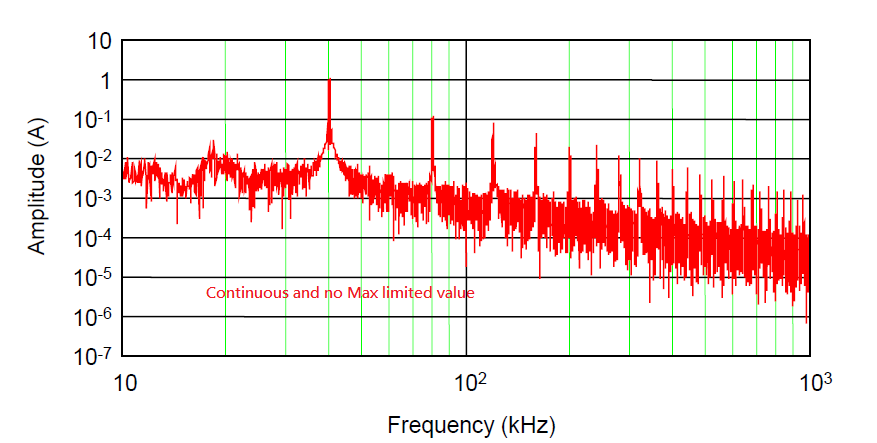
2. the frequency spectrum is discrete and not continuous similiar to the following screen capture:

Is there any other method (function) which support to plot a continuous frequency spectrum of a specified signal ?

thank you very much.

  • ericsson sunshine,

    I do not know of a way to make TINA-TI simulate the frequency spectrum of a transient simulation.

    The Fourier series is used to show how much amplitude is contained in each harmonic. In the case you have shown (picture), there are only 25 harmonics shown, which is far less than the 64 harmonics you specified. You will also note that the amplitude of the harmonics in your waveform (pictured, not simulated) drop to less than 0.01 of the fundamental at about the 7th harmonic, so 99% of the waveform can be determined with only the first 7 harmonics.

    So exactly what are you trying to use this information for? When you ran the TINA-TI simulation, you basically got a square wave response. You then took the Fourier series of the square wave and were shown the Fourier coefficients of the 64 harmonics requested. If you look at the simulated Fourier information, you would see that the first 14 harmonics contribute to the amplitude of the signal (a square wave) and the rest not so much.

    The base frequency of the picture you have shown is 40Hz.

  • Hi Britt:

    Thank you. I could understand.
    If once (TI) get a chance, please consider to advice (DesignSoft) to add this function (or called FFT somewhere else).
    For some applications which included more than one signal source and users want to know some information from the powerline current analysis in frequency spectrum.I think they might need that.

    For example, to place a noise filter in front of the application schematic which comprised of more than one switching product (means there are different switching frequencies) and try to tune many parameters to optimize good EMI performance.(Excuse me, I didn't really route one TINA file yet. The pictures was just tring to describe the function I had mentioned and tried.)

    But this is not about the simulation itself. This is about the peripheral software.
    And evolution might always takes time.(I mean to add this FFT function.)

    Thank you very much.