This thread has been locked.

If you have a related question, please click the "Ask a related question" button in the top right corner. The newly created question will be automatically linked to this question.

TINA/Spice: How can I "measure" the impedance in a circuit?

Other Parts Discussed in Thread: TINA-TI

Tool/software: TINA-TI or Spice Models

Hello, I am trying to calculate the impedance seen on a node. The circuit below is provided just as an example of what I am trying to accomplish.

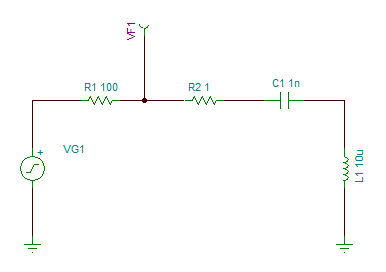
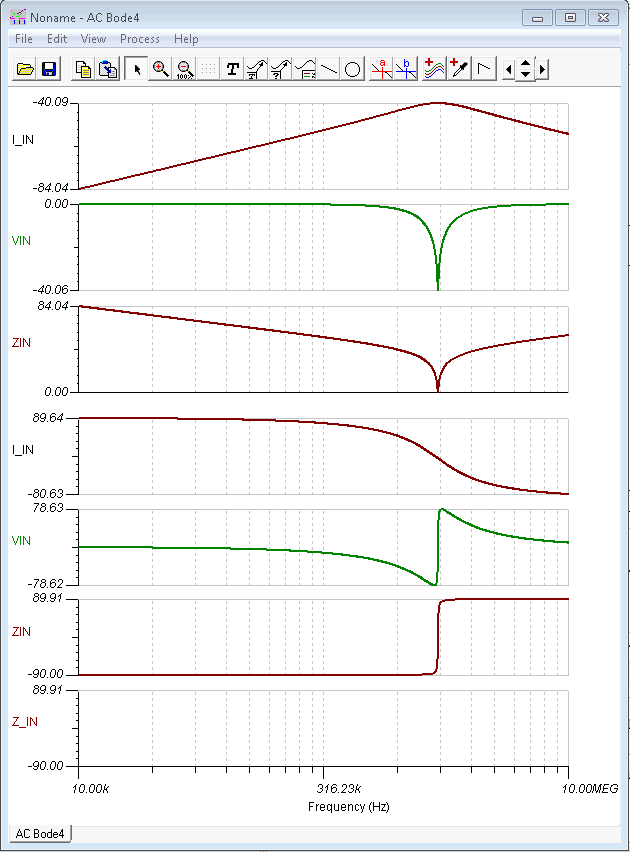
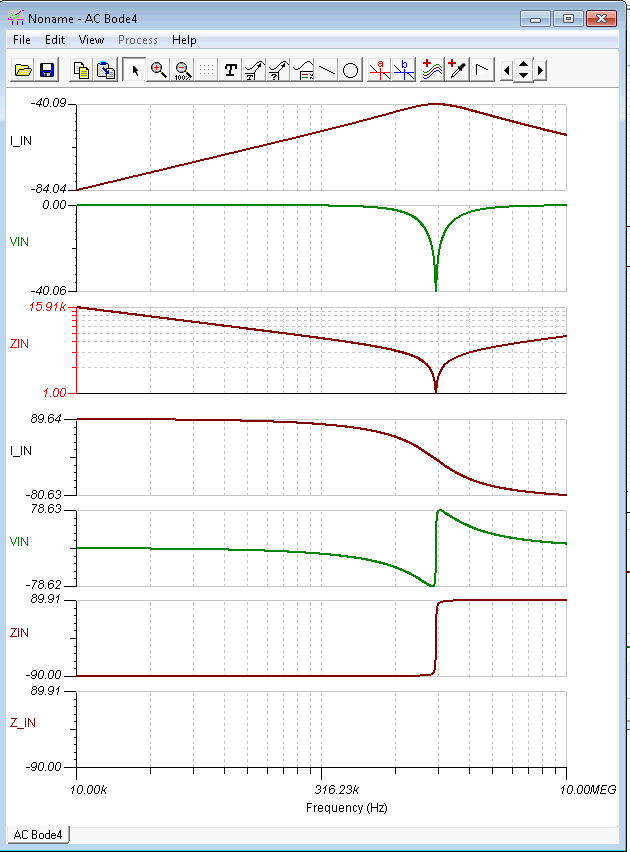
I am varying C1 from 1 to 10nF and L1 from 1 to 10uH. I get this:

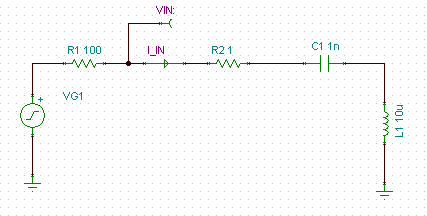
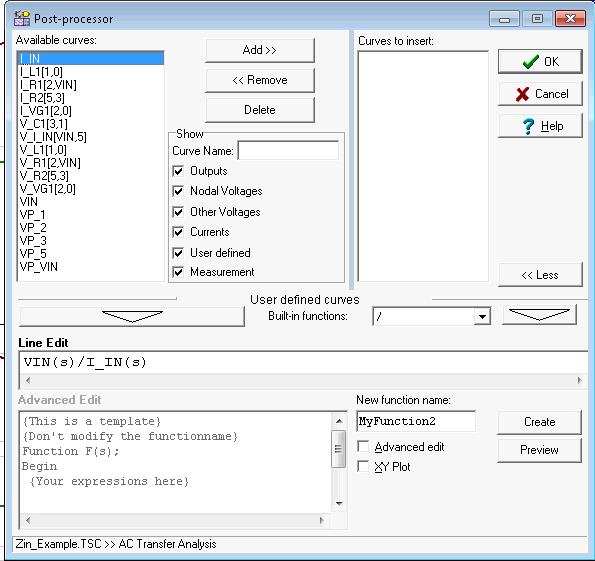
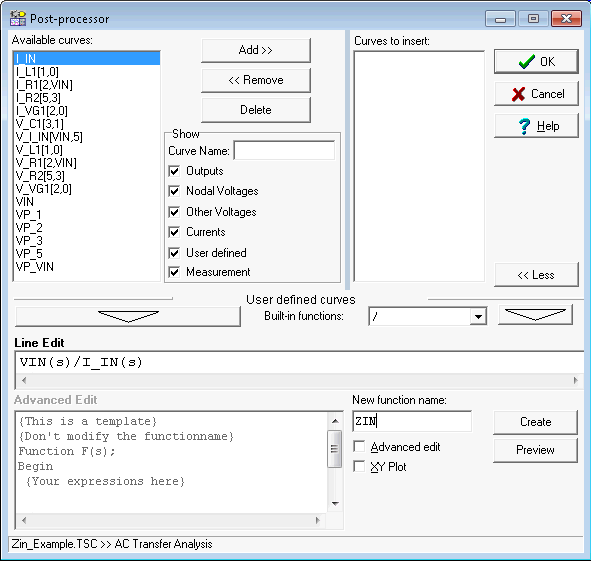
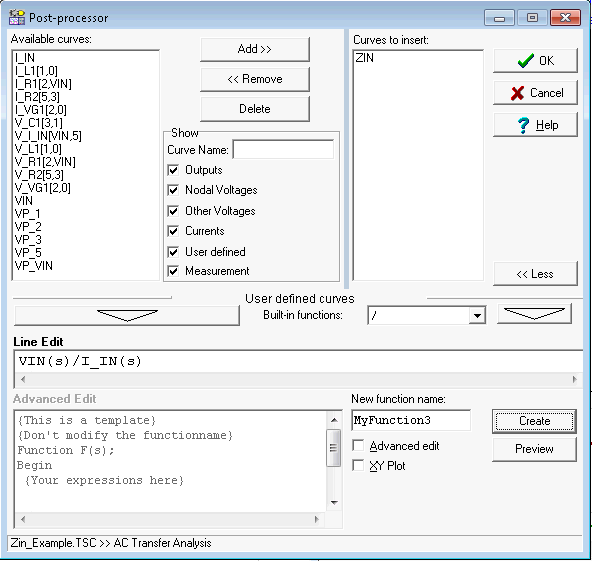
Now, I would like to have the impedance seen on node VF1, comprised by the RLC. With LTSpice is just a matter of adding a trace with the quocient between V(vf1) and I(R1).

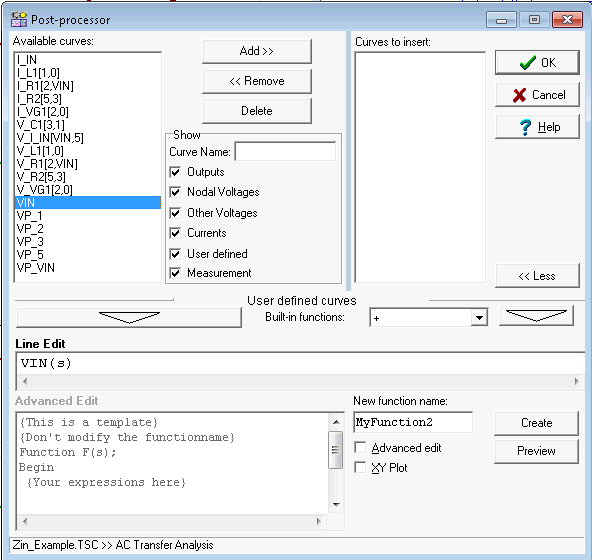
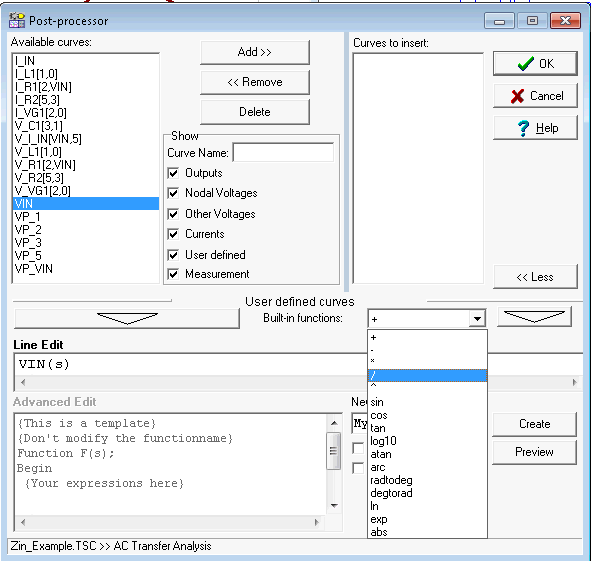
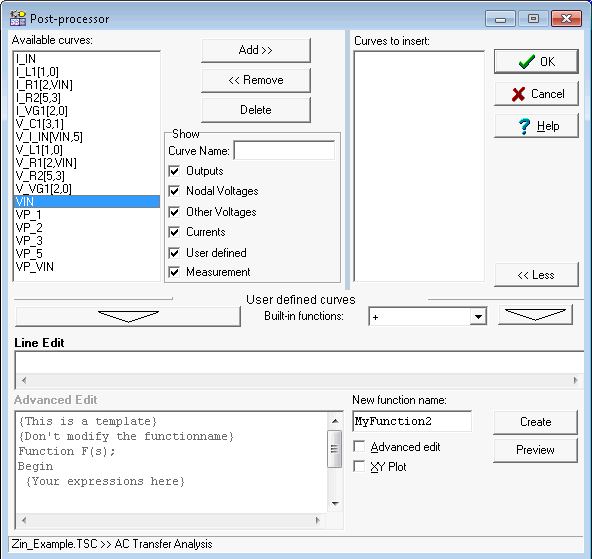
I could not figure out how to do the same with TINA in a simple way.

Thank you in advance for any hint on this.

  • You can simulate the Zin in TINA-TI with a few simple steps.

    In your example, add a current probe at the input of your circuit as shown below.
    You are now monitoring the input voltage and the input current.

    Run an AC sim, and in the resulting plot window select the icon with three wavy lines ( ).
    This will open the graphics post-processor in a separate window.
    The parameters from the voltage and current probes will appear in the Available Curves field (see the graphic below).
    Select VIN and press the downward-pointing arrow below the field. VIN should appear in the Line Edit field as shown below.

    Select the "/" in the Built-in Functions pull-down as shown below:

    Next, select the quantity  I_IN from the Available Curves list and click the downward-pointing arrow.
    The ratio VIN/I_IN should appear in the Line Edit field as shown below.

    Next, enter the desired name for the function in the New Function Name field as shown below:

    Press the Create button next to the New Function Name field and the function name should appear Curves to Insert field
    in the upper right of the window.

    Press OK and the post-processing window will disappear and the ZI_IN curve should appear in the plot.

    The default vertical scale for the new function is dB. To change this to linear units (Ohms) double-click on the Z_IN vertical scale for
    and the Set Axis dialog box will appear with the default units in Linear-dB.

    Select the arrow in the Scale drop-down and select Logarithmic or Linear and select OK.

    The resulting plot:

    I hope this helps. Please let me know if you have any questions.
    Regards,
    John

  • Hi, John.

    First of all, thank you very much for such a fast response. That partially solves my problem. As I iterate through 10 values for each, L and C, I end by having 100 voltages and 100 currents indexed (AM1[*] and VF1[*]). Is there a way I can have TINA to plot all the impedances (i.e. VF1[1]/AM1[1], VF1[2]/AM1[2] and so forth)?

    I use that to visually assess the response of the circuit and to locate points of interest I may want or need to look more closely to. Kind of pointless with this simple RLC circuit but very useful with more complex OA circuits I am designing/analyzing.