Tool/software: TINA-TI or Spice Models
The TINA Help lists under Analysis menu > Transient Analysis the following ...
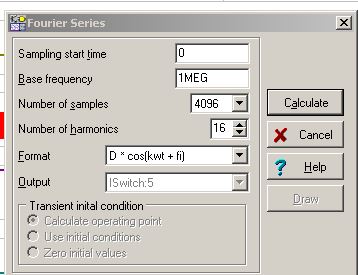
Once the Transient analysis result is on screen, you can run a Fourier Series or Fourier Spectrum analysis. Place the cursor on the curve of interest and click the right mouse button. This brings up a small menu, offering these options (among others relating to display characteristics):
Fourier Spectrum
Fourier Series
Statistics
Now when I do that, I get a menu, but with completely different entries ...
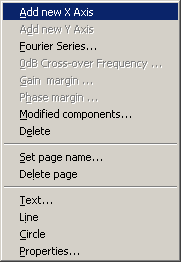
How can I get statistics for the resulting curve?
Thanks in advance,
Herbert