Other Parts Discussed in Thread: TINA-TI,
Tool/software: TINA-TI or Spice Models
Hello,
I'm trying to figure out how get noise figure from the TINA noise analysis, using the LMH5401 as an example. However, I've been unable to get the simulation to match the datasheet and I'm not sure what I'm doing wrong.
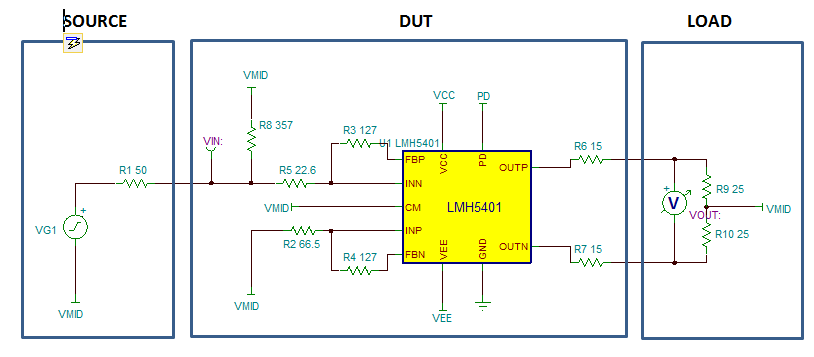
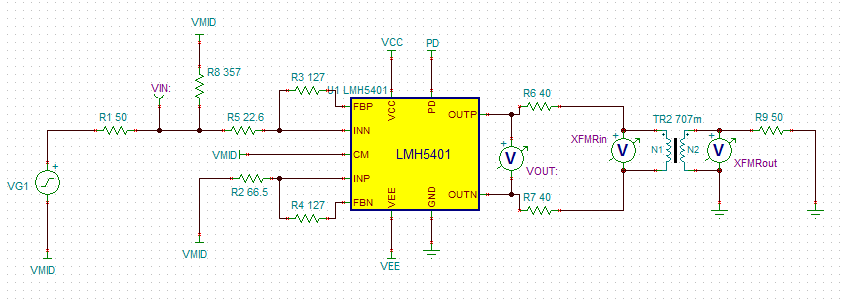
I'm using the LMH5401 TINA Reference Design from the product page as an example. I ran a noise analysis and the input-referred voltage is pretty close to the figure in the datasheet, although not exact (for example, TINA shows 5.8 nV/Hz at 1 kHz, whereas the datasheet shows about 4 nV/Hz).
Next I tried to calculate noise figure using SNR_Vin (dB) - SNR_Vout (dB). Using numbers from the TINA SNR plots at 200 MHz, this works out to a NF of 15.1 dB. However, according to the datasheet it should be 9.6 dB.
The difference I'm seeing in input-referred noise should explain part of this discrepancy, but not all of it. Am I doing something wrong with my noise analysis and NF calculation, or is this just due to the model?
On a related note, is is possible to add noise figure to the diagram with a post processor function?
I should mention that I'm not necessarily planning to use the LMH5401 in my design. For now I'm just using that reference design as a test to see if I can get a NF from TINA that agrees with the datasheet.
Thanks,
Mark


