This thread has been locked.

If you have a related question, please click the "Ask a related question" button in the top right corner. The newly created question will be automatically linked to this question.

TINA/Spice/CSD19533Q5A: VDS vs ID

Part Number: CSD19533Q5A
Other Parts Discussed in Thread: TINA-TI

Tool/software: TINA-TI or Spice Models

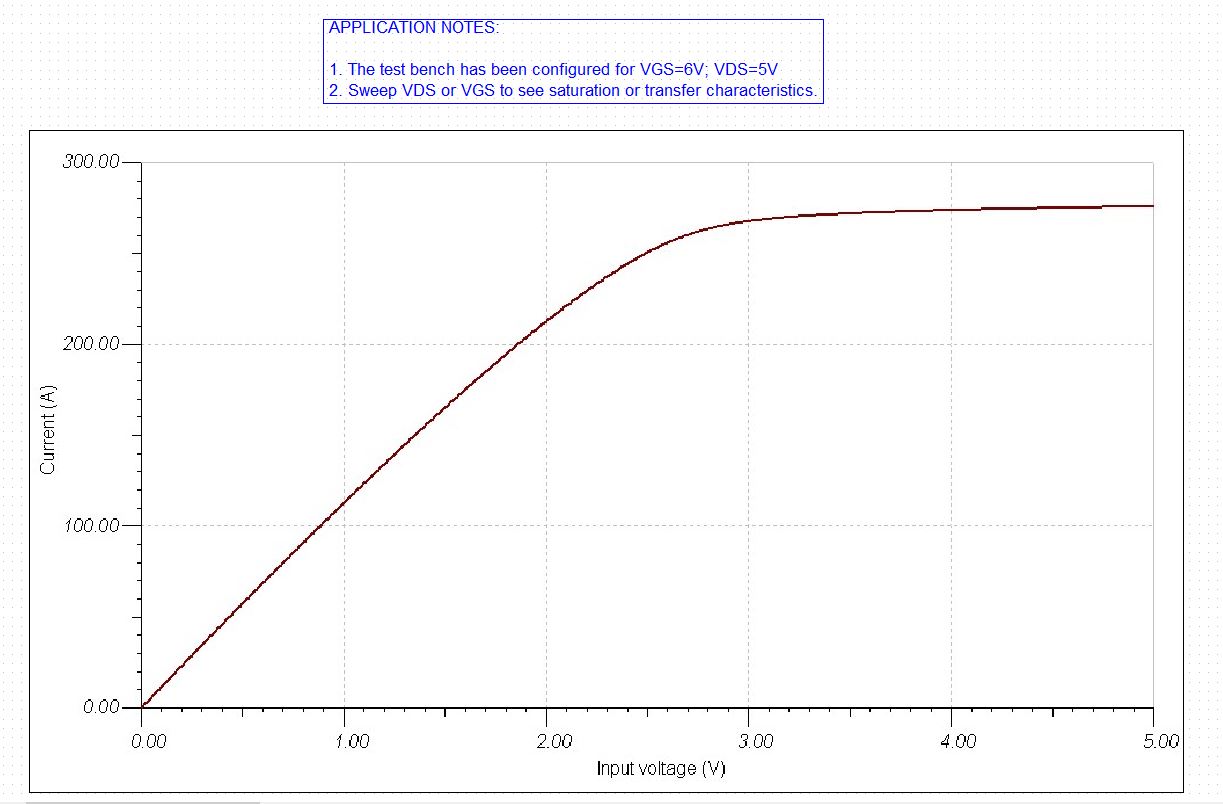
Please provide the latest VDS vs ID curve as I think the one given in the datasheet is wrong and it also does not match with the spice model results obtained from the TINA spice.

  • Hi Harsh,

    1. Do you conclude the inaccuracy of the datasheet by comparing it to your lab measurement perhaps?

    2. Based on your observation, does the spice model not match with datasheet or does the spice model not match as well with your lab measurement perhaps?

    If you can attach any graph/picture of your measurement result or comparisons between lab result, datasheet, spice model that will be helpful for us to narrow things down.

    Thank you,
    Herman
  • Hi Herman,

    Thanks for a response.

    I don't have any lab measurement as I am in a stage of designing and while doing the simulation I am able to see the difference between the datasheet curve and the Spice model.

    Form Datasheet.

    From spice Model:


    I just want to know which one should I follow as there is a big difference between the Idsat of both the curves.

    Regards,

    Harsh

  • Harsh,

    The datasheet curve is correct, I spoke with some of the technologists and they say the model is optimistic and loses accuracy above 0.5V or so. Please use the datasheet curve.
  • Thanks, Chris.