This thread has been locked.

If you have a related question, please click the "Ask a related question" button in the top right corner. The newly created question will be automatically linked to this question.

TINA/Spice/TPS548A20: Thermal analysis-TINA TI

Part Number: TPS548A20
Other Parts Discussed in Thread: TINA-TI,

Tool/software: TINA-TI or Spice Models

Hello Team,

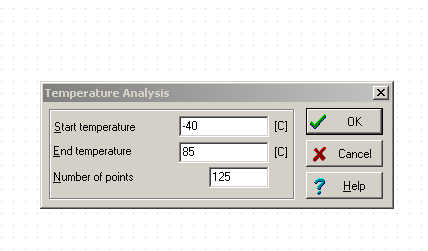
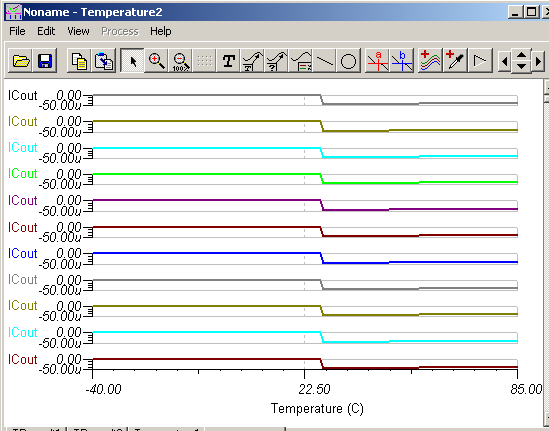
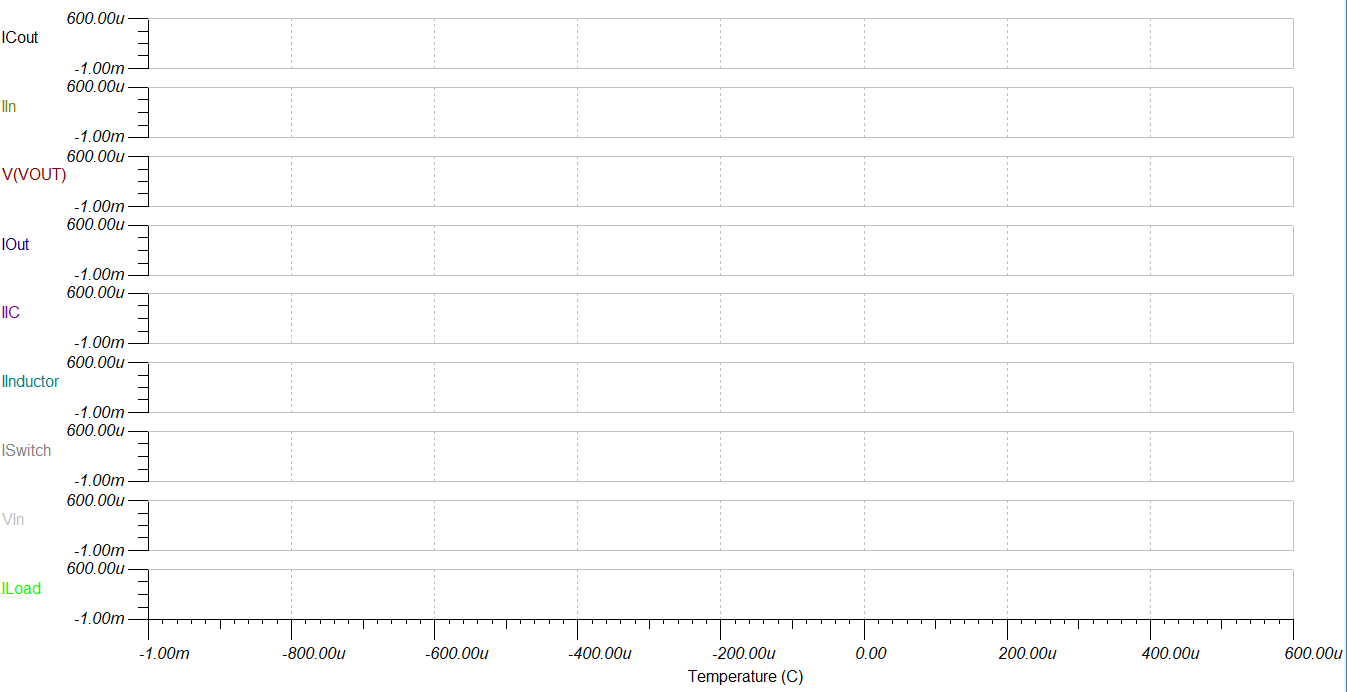
I'm trying to simulate the output variations to temperature variations(-40 to 85C). My input is a signal 6-17V while my output should be 3.3 V. This works with TPS548A20 with webench model, I attached the  result of the simulation. I don't understand

1)why the x axis shows in uC? I inserted as parameters (-40 to 85)

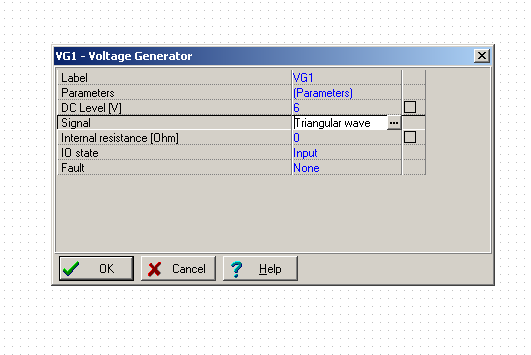
2) the signal generator is set arbitrarly, as a ramp going from 6V to 17V. why the waveform are not shown?

Note That TINA-TI does not tell about any error before performing the simulation.

  • Hi Elisa,

    FYI, one of our team will take a look at this.

    Herman
  • Hi Elisa,

    Please use the attached .TSC file and do the following steps to get output variation to temperature variation.

    1. Go to Analysis option and click on DC Analysis

    2. Then click on Temperature Analysis and a window like below will open up

    3. Here you could insert values for temperature range with no of points

    Below is the the results of the output variation to temperature variation


    webench_design_4688694_19.tsc

    Hope this will help you.

    Best Regards,

    Ashis

  • I did not understand how to plot Vout (that's what I need).

    Can you include in this webench model (exportable in TINA-TI) also the input signal? (for example a triangle waveform of 11 V with a DC offset of 6V).

    I tried to include it in my model but it did not work with the thermal simulation.

    Best regards

    Elisa

  • I was looking for the simulation of Vout, not Iout.
  • Hi Elisa,

    Thanks for your patience.

    Unfortunately, thermal characteristics of this device is not modelled. Hence you cannot observe any changes in the model simulation results w.r.t temperature.

    Sorry for the inconvenience.

    Please let us know if you need any further assistance.

  • Hi Elisa,

    Please use the attached TPS548A20.TSC  to see the output variation to temperature variation.

    TPS548A20.TSC

    Below is the simulation results of all the probed nodes.

    Also you could include input signal of 11 V with a DC offset of 6V by doing the following steps:

    1.Select Sources from the window shown below and then select voltage generator from that

    2. In that choose triangular wave with required voltage with a DC level as shown in the below window.

    Best Regards,

    Ashis

  • Hi Ashis, 

    as I wrote at the beginning, the simulation does not work if I follow in TINA the procedure you said. (inserting the waveform signal in the voltage generator). Why is the x-axis displaying those values?

    Here an attachment, Any suggestion?

  • Hi Elisa,

    Please verify the Start and End temperature values to be provided in dialog box.

    Also please note that the thermal characteristics of this device is not modelled. As you are internal to TI, we will have further communication through email and hence I will be closing this thread.