This thread has been locked.

If you have a related question, please click the "Ask a related question" button in the top right corner. The newly created question will be automatically linked to this question.

WEBENCH® Tools/LMR14050-Q1: Simulation data and graph is different

Part Number: LMR14050-Q1

Tool/software: WEBENCH® Design Tools

Hi all,

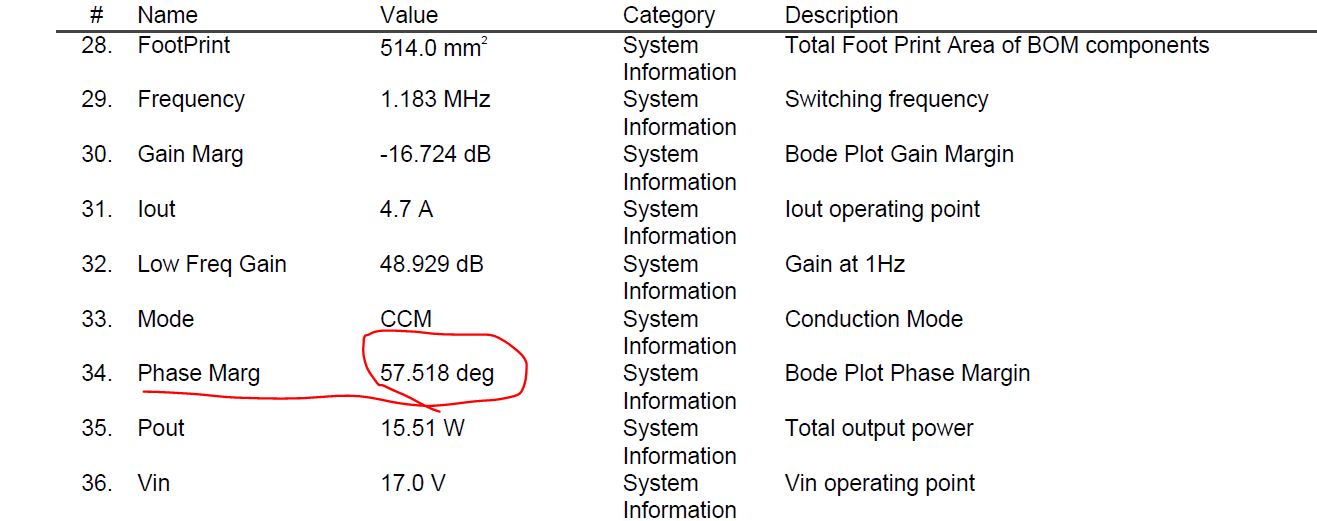
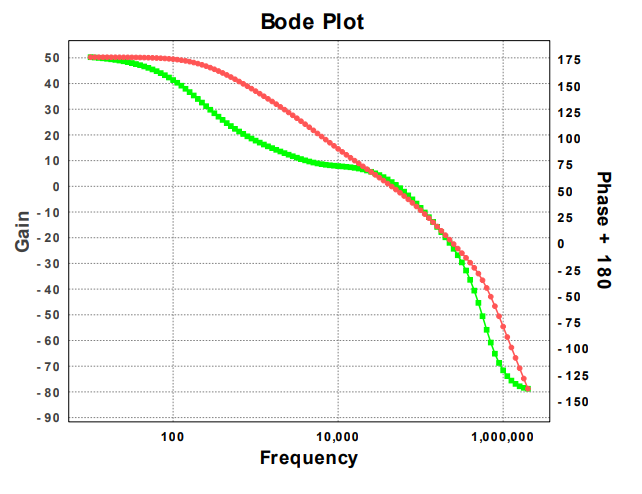
I simulated the buck converter, phase margin is 57.518 degree on the data, but the graph shows 30~40 degree phase margin, why those are different?

I attached the simulation sheet and pictures.

4.pdf