This thread has been locked.

If you have a related question, please click the "Ask a related question" button in the top right corner. The newly created question will be automatically linked to this question.

TIDA-01580: Setting control registers for the AFE4900 through BLE

Part Number: TIDA-01580
Other Parts Discussed in Thread: AFE4900

Hi,

I have two working versions of the TIDA-01580 design running the default TX firmware, and an external BLE dongle that reads the data. I'm testing both devices, mostly focusing on the ECG signal for now. I see that I'm getting several parallel signals that I need to average (I assume this is based on the NUMAV settings in register 1E).

My problem: The two devices seem to have two different NUMAV settings, and none of them match the default value in the AFE_default_reg.h (The default value is set to 3, and I see 10 for one of my devices and 2 for the other). Since their initial programming, I didn't touch their firmware, but I did use the given evaluation software with the Launchpad.
So I assume either the device changes the settings for itself automatically (is there an autocalibration or something?), or there is a way to change them through BLE? I've only found three available characteristics (pdu, phy and toggle_throughput). Is there something I've missed here? Is there a way to read/write these registers through the BLE without having to rewrite the firmware?
Thanks!
  • Hi,

    The NUMAV is set to 3 as you have highlighted. There is no automatic calibration done in the firmware to modify NUMAV bits.

    Also, there is no way to change the settings through BLE as we haven't implemented the reverse path (from Launchpad to TIDA board).

    I suggest to verify the firmware before and after testing - is it being modified by something else?

    Regards,

    Sanjay R. Pithadia

  • Hi Sanjay,

    Thank you for the fast answer. So let me just clarify that I understand it correctly: If the NUMAV is set to 3, then I should be seeing 4 signals (NUMAV +1) or I should be seeing 8 because there is also the ECG_CHOP flag?

    Thanks!

  • Hello Nora,


    The datasheet explains in the following manner:

    When using PTT mode, the NUMAV register control gets applied to the fourth phase (ECG signal acquisition phase). When NUMAV is programmed (for example, if NUMAV = 3), the ADC converts the input four times in each phase, averages the four conversions, and stores the averaged value in the register corresponding to that phase. When chopping mode is enabled (ENABLE_ECG_CHOP = 1), the ADC performs two conversions as though NUMAV is set to 1.


    I guess you should see 8 conversions with CHOP function.

    Since I have not used CHOP function, I am unsure of this answer. I will get back with answer after checking with the relevant support team for AFE4900.


    Regards,

    Sanjay R. Pithadia

  • Hello Nora,

    Let me jump in and clarify regarding NUMAV.

    When using PTT mode, the below description details how the NUMAV register control gets applied to the fourth phase (ECG signal acquisition phase).

    • When chop function is disabled, then the ADC averaging is performed based on the NUMAV setting. In this case, you will need to ensure that the CONV width is greater than the number of conversions based on the NUMAV setting.
    • When chop function is enabled, then irrespective of the NUMAV setting, the ADC performs 2 conversions as though NUMAV is set to 1. In this case, you will need to ensure that the CONV width is sufficient for atleast 2 conversions.

    Number of conversions based on the NUMAV setting all happen within 1 PRF cycle and so irrespective of any aforementioned scenario (assuming the CONV width is setup correctly), you should be getting only 1 averaged value per PRF cycle.

    Also the AFE does not automatically change the NUMAV register unless it is programmed to change the value by the host.

  • Hi,

    Thank you for the clarifications. However, this brings up a lot more questions... Currently, I'm using the default firmware provided with the TIDA-01580, and I didn't touch the AFE settings. As far as I understand from your explanation, the averaging is happening within the device and I'm supposed to receive a single ECG signal. Instead, as I've said before I'm receiving samples that look like 10 parallel signals. If I average them in blocks of 10, I'm getting something that looks like an ECG... If this phenomenon is not caused by the NUMAV then what can it be? Since I'm using the default device and a default firmware, it seems very unlikely, but can it be a bug? Also, I guess it's worth mentioning, that I see correct data for the red PPG and for the IR PPG, but the green one seems to be constantly saturated. It is supposed to run an autocalibration. Right?

  • Hi,

    Can you please share the picture of ECG and green PPG signals?

    Are you using LabVIEW™ 2016 Development Engine or Runtime Engine?

    Regards,

    Sanjay R. Pithadia

  • Hi Sanjay,

    Over the weekend I've noticed a few things so I'm going to rephrase the problem a bit:

    1. When I use the TIDA demo software I see ECG signals on both devices. Most of the time the demo software shows 0 for the green PPG, but it does react to changes like when I move my finger, so I assume that the sensor works fine it's just saturated. Also through the UART I constantly receive '0x1fff19' which is the number for saturation. Right?

    2. When I plug in my laptop charger, it makes the ECG recording much noisier on the demo software, so I assume there is power line interference. If the ECG is sampled on 500Hz, and the power is on 50Hz, then a power line interference can explain why I thought that I'm seeing 10 signals... So the NUMAV issue is solved:)

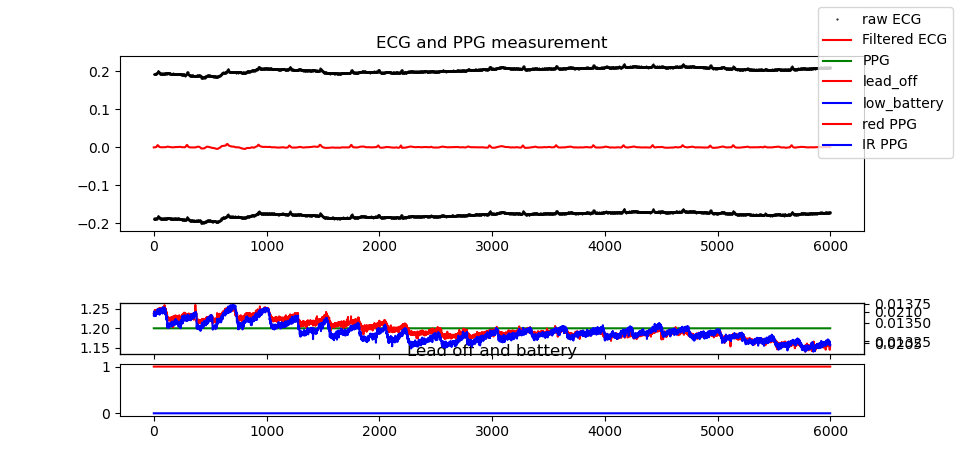
    3. I've developed my own application which is Python-based and I'm using a BLE-UART bridge to receive the data. When I don't have my charger plugged in, the ECG signal looks like it's composed of two different signals (black lines on the graph below). Is it supposed to look like this? With averaging every second point, I'm getting something that looks quite good. Is it because of the CHOP_ECG register?

    I've attached a few pictures to demonstrate the phenomena.

    Thanks a lot!

    Screenshot from the TIDA demo:


    Measurement in Python

  • Hello Nora,

    Regarding the Green PPG, I feel the sensor is not connected properly (may be a short on the connectors??). It looks like data is not being captured on the photodiode for Green LED.

    Looking at ECG on TIDA GUI screenshot, it is clearly the line interference (50/60Hz) which you can remove using notch filters in your firmware.

    For the screen shots in Python, I feel you are getting data but amplitude needs to be scaled to fit to the screen. Lot of filtering is also required.

    Just to highlight: we have implemented following filters:

    •ECG

    BPF – IIR Butterworth 1st order (0.3Hz to 90Hz)

    HPF – Bessel 1st order (0.1Hz)

    BSF – 1st Order Elliptic (45Hz to 65Hz)

    •PPG

    BPF - FIR with 511 taps (0.1Hz to 10Hz)

    •The filters could be simplified if there are performance constraints.

    Regards,

    Sanjay R. Pithadia