This thread has been locked.

If you have a related question, please click the "Ask a related question" button in the top right corner. The newly created question will be automatically linked to this question.

CC2640R2F: CCS Debugger and Interrupt processing

Part Number: CC2640R2F
Other Parts Discussed in Thread: LAUNCHXL-CC2640R2

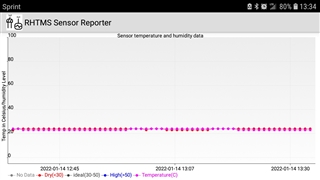
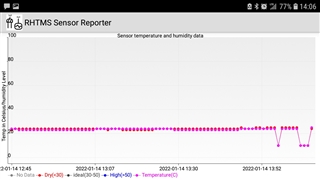
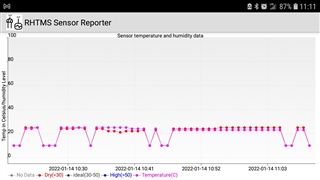
My ISR successfully detects and processes all rising edges of a high speed 40 bit pulse train 100% of the time when the application is run using the CCS Debugger but only 60% of the time when not run by the debugger.  (The 40-bit pulse train is a sequence of 30us and 80us pulses separated by 50us.)  This behavior is 100% repeatable.  Obviously, the Debugger is changing something.  Where is it documented what changes the debugger implements in its setup that changes the behavior of the ISR?

  • Hi Jay,

    There is no direct resource that addresses this question.  An active debugger connection does affect the rate at which the device processes data.  How are you counting interrupts and observing this behavior in the CCS debugger as compared to free running?  Is your device designed to enter standby or shutdown mode, or is another other hardware processing occurring inside your firmware?  Can you provide code snippets so that this can be replicated? https://e2e.ti.com/f/1/t/1011192 

    Regards,
    Ryan

  • Thanks for the reply.


    1. Concerning how I count interrupts and observe the behavior, here’s the background:

    I am collecting data every 60 sec from a DHT11 humidity module using the TI LaunchXL-CC2640r2.  The DHT11 transmits a 40-bit pulse train consisting of five 8-bit words.  A “0” bit is 30us long Vcc voltage..  A “1 bit is 80us long Vcc voltage.  Each bit is separated by a 50us GND voltage.  The 5th word is a checksum from the DHT11.  I compute a checksum from the 4 other data words and compare against the DHT11’s checksum.  If equal, I've received all the data correctly.  If not equal, something went wrong.  I use a DSO to capture the pulse train so that I can interpret the data manually and verify the operation of the TI LaunchXL-CC2640r2 app.

    I observe the behavior from graphs of the DHT11 data generated by an Android app that communicates with the TI LaunchXL-CC2640r2 app to receive the DHT11 data history.  A data point of (10,10) indicates a checksum problem.   Checksum problems are easily seen as dropout points on the graph.  

    Below is a screenshot of data from the Android app collected when running via the TI LaunchXL-CC2640r2 app via CCS debugger.


    Note there are no dropouts. 

    I stopped the debugger at 1344 but let the TI LaunchXL-CC2640r2 app continue running from the USB connection on my laptop.  Below is the screenshot taken at 1406.  Note all of the dropouts, (10,10) starting around 1354.  


    As another example, below is a snapshot taken 2 hours earlier where the TI LaunchXL-CC2640r2 is connected to a USB AC power adapter.  Note all of the dropouts.

    So, running via the CCS Debugger generates a 0% sampling error graph.  Running outside of the debugger, whether by stopping the CCS debugger or using a standalone USB AC adapter, or just plugging into a USB port on my laptop all generate sampling errors, typical around 40%.  This is repeatable behavior.

    2. Concerning other hardware processing, there is no other hardware interrupt processing. 

    3. Concerning power management changes, I am using the BLE5 Simple Peripheral cc2640r2lp app and added the following statement to the SimplePeripheral_init() for long distance communication to the Android app:

    ***

    HCI_EXT_SetTxPowerCmd(HCI_EXT_TX_POWER_5_DBM);

    ***

    For completeness, below is the entire ISR code that implements the DHT11 protocol.    Note that once the 40-bit data train is detected, the ISR does not release control until all pulses are processed or the timeout counter expires.  I’ve had problems with the ISR latency with other implementations and this is the only implementation that is fast enough.  Traditional edge transition interrupt processing resulted in 3% sampling errors, debugger or not.  The current technique results in 0% sampling errors but only when running via the Debugger.  However, when running without the Debugger, there is generally a 30% sampling error.

    ****

    static void Board_keyCallback(PIN_Handle hPin, PIN_Id pinId)

    {

        int16 ctr=0;

       if (DHT11_state == DHT11_DATAAVAILABLE){                   // moved to first to shorten processing time to get to this case.

           while(iDHT11Data<40) {

           pulseend[iDHT11Data++]=HWREG(GPT0_BASE + GPT_O_TAR); // get the timer value for this pulse

           while(PIN_getInputValue( Board_SPI0_CLK)==0 && ctr < 32000) ctr++;

           ctr=0;

           while(PIN_getInputValue( Board_SPI0_CLK)==1 && ctr < 32000) ctr++;

           }

       } else if (DHT11_state == DHT11_WAKEUP){

          DHT11_state=DHT11_AWAKE;

          PIN_setConfig(hKeyPins, PIN_BM_IRQ, Board_SPI0_CLK    | PIN_IRQ_POSEDGE);

       } else if (DHT11_state == DHT11_AWAKE){

          DHT11_state=DHT11_DATAREADY;

          PIN_setConfig(hKeyPins, PIN_BM_IRQ, Board_SPI0_CLK    | PIN_IRQ_NEGEDGE);

       } else if (DHT11_state == DHT11_DATAREADY) {

          DHT11_state=DHT11_SENDINGDATA;

          PIN_setConfig(hKeyPins, PIN_BM_IRQ, Board_SPI0_CLK    | PIN_IRQ_POSEDGE);

       } else if (DHT11_state == DHT11_SENDINGDATA){

          DHT11_state=DHT11_DATAAVAILABLE;

          PIN_setConfig(hKeyPins, PIN_BM_IRQ, Board_SPI0_CLK    | PIN_IRQ_NEGEDGE);

          pulseend[iDHT11Data++]=HWREG(GPT0_BASE + GPT_O_TAR);  //quicker?

       }

    }

    *****

  • Hi 

    Thanks for your detailed response, that helps a lot, the BLE stack may conflict with your callback function.

    To start with, you may run example without BLE stack or try to use the sensor controller to avoid conflict, and  count interrupts or observe if this behavior happens again.

    Thanks

  • Hi

    I'm going to close this thread, please feel free to respond if anything else come up.