Hello, experts. I'm conducting experiments with the RTLS example. But I ran into some problems. My devices and environments are as follows.
Devices:
- CC2652R × 2
- boostxl-aoa × 1
Environments:
- cc13xx_cc26xx_sdk 6_10_00_29
- CCS 11.0.0
I am using the rtls_coordinator and rtls_responder examples. The boostxl-aoa is plugged into the CC2652R in which the rtls_coordinator example was flashed. The relevant configurations are the following.
Rtls_connected.py:
# ...
        "aoa_pattern_len": 3,
        "aoa_ant_pattern": [0, 1, 2]
# ...
scan_time=6,
connection_interval=10,
continues_connection_info=False,
angle_of_arrival=True,
angle_of_arrival_params={
    'enable_filter': True,
    'slot_duration': 2,
    'sample_rate': 1,
    'sample_size': 2,
    'cte_length': 20,
    'cte_interval': 2
},
data_collection_duration=30
# ...
Antenna DIO configuration:
// DO NOT EDIT - This file is generated by the SysConfig tool.
// Antenna DIO configuration (should be adapted to the antenna board design)
uint32 antennaTbl[] = {
BV(27) | BV(28),
BV(27) | BV(29),
BV(27) | BV(30)
};
The angle notation I used is consistent with the image below.
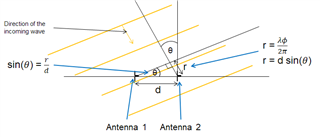
I find that the estimated AoA is usually far from the real θ. At first, I thought it was caused by environmental interfaces. Then I chose an open space and tried experiments again, but it didn't work.
In order to illustrate my question, I would like to let θ equal 90°. In my situation, the estimated AoA is incorrect and unstable. In other words, it is far from the true θ and is variable. After that, I dived into the phase of IQ.
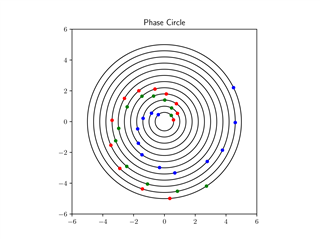
The following figure shows the phase diagram of a representative packet. According to my configuration, the A1.x of the boostxl-aoa was used. I used red dots for antenna A1.1, blue dots for antenna A1.2, and green dots for antenna A1.3. In making the following plot, the first eight (1...8/45) and last IQ samples (45/45) were omitted. Thus, only 36 samples are plotted in the figure. In this case, the innermost circle represents the ninth to eleventh samples, and the outer circles represent subsequent samples.
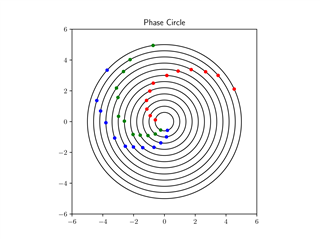
The phase rotation in the above figure is clearly inconsistent with expectations. There are two main points.
1. The phase rotations from red to blue and blue to green do not match.
2. The phase rotation from red to blue is higher than expected. Theoretically, it is a maximum of 0.56π (≈101°), while the phase rotation in the figure is clearly beyond 180°.
1. The phase rotations from red to blue and blue to green do not match.
2. The phase rotation from red to blue is higher than expected. Theoretically, it is a maximum of 0.56π (≈101°), while the phase rotation in the figure is clearly beyond 180°.
This incorrect phase rotation creates great difficulty in solving AoA. I would like to ask the experts if any similar problems have been encountered. What are the possible causes of this problem? How should I proceed to debug this problem in depth?
I would be grateful if I could get your help.
I would be grateful if I could get your help.