Hello,
I have configured my peripheral device in periodic advertisement mode and want to understand a bit about the current waveform. I am referring to document on this link for developing understanding - Link
In the documentation, periodic advertisement process has following description -
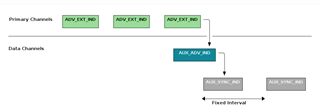
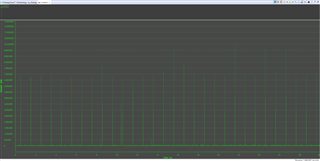
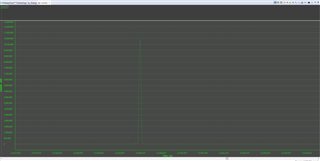
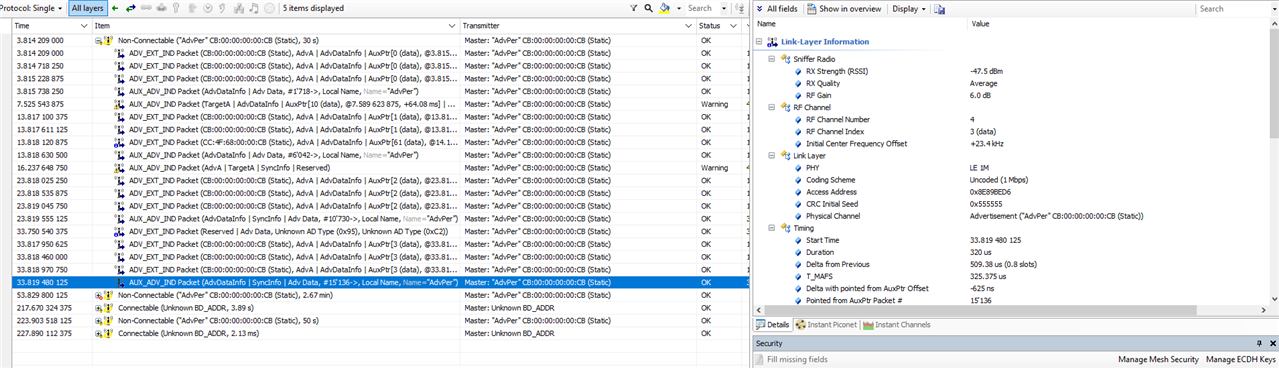
I was expecting an extra peak in current waveform because of the AUX_ADV_IND sent on the data channel.
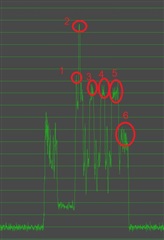
Does the peak in circle 5 represent the transmission on data channel and circle 2-4 represent transmission on primary advertising channel? Is it the right way to think about this?
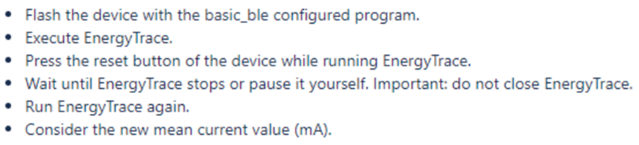
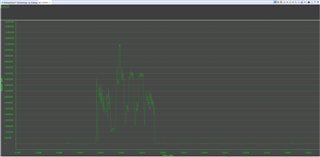
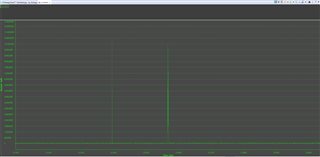
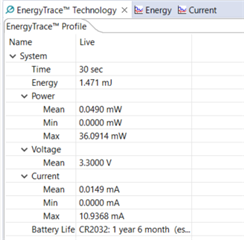
Another thing I am not able to understand is why circle 2 (Which I am assuming is the transmission on primary advertising channel) is way higher than others. These waveforms are generated using energy trace in CCS IDE.
Thanks,
Garvit