This thread has been locked.

If you have a related question, please click the "Ask a related question" button in the top right corner. The newly created question will be automatically linked to this question.

CC2640R2F: CCS stack allocation / usage

Part Number: CC2640R2F

Tool/software:

Hi,

I am trying to figure out through CCS (Version 12.7) what stack size is being allocated and used by a project. This seems to raise a lot of ambiguity.

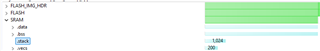
When clicking on the compiled project Memory Allocation view, the stack section is given as 1024 units.

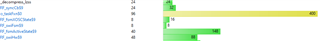
When checking the Stack Usage view, the maximum inclusive size of a function is 400 units. Hovering over this bar shows "400 out of 400 units used (100%)", implying that the stack is 400 units.

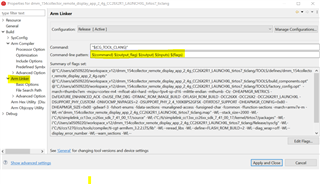
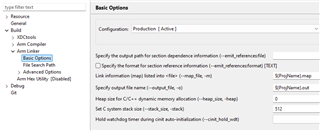
The Arm Linker options in project properties initially showed the C system stack size as 256. Increasing this to 512 and re-running the build had no effect on the reporting of total units in the Stack Usage view or the stack section of the Memory view.

So:

  • How do these three views / controls tie together and why do they seem inconsistent?
  • Is the largest inclusive size as reported by the Stack Usage view guaranteed to be the largest required stack?
  • How do you go about increasing the stack size if so desired?

Regards,

Jamie

  • Hi Jamie,

    Which project are you using?

    Have you checked the user guide? This might be helpful, it is a stack-related content: https://dev.ti.com/tirex/content/simplelink_cc2640r2_sdk_5_30_00_03/docs/ble5stack/ble_user_guide/html/ble-stack-5.x-guide/debugging-index.html?highlight=rov#viewing-the-system-stack

    Thanks,
    Toby

  • Hi Toby,

    The project is based on the blestack simple_peripheral_oad_onchip example. I am aware that you can view the runtime stack usage using ROV but I was more wondering about the seeming internal inconsistency in the stack information presented in CCS. Also how reliable the Stack Usage information is relative to checking dynamically.

    Regards,
    Jamie

  • Thanks for confirming!

    I have notified a colleague who is more experienced with analyzing/debugging BLE projects.

  • Hello,

    Thanks for reaching out. I am taking a look at the example, could you confirm this is the latest SDK (5.30)?

    Have you take a look at the stack usage with TI-RTOS Object Viewer? Viewing the State of Each Task

    BR,

    David.

  • Hi David,

    Yes this is the latest (5.30) SDK. As indicated I am aware of the operation of the ROV for dynamically checking stack usage. The question was related to the stack related figures presented in CCS, however, and why they are inconsistent.

    Regards,
    Jamie

  • Hello Trackert,

    Thanks for the patience. This is more of a tool related question.

    The "Stack Usage" view shows the maximum stack which will be used by a program based upon a static analysis of the call tree and stack usage of each function. Whereas the "Memory Allocation" view shows how much memory has been allocated for the stack by the linker. Therefore they provide different information.

    The 400 value is the maximum system stack usage of the application or worst case depth (including all calls done in that function and from that function). The function "...taskFxn$0" shows 400 out of 400. Where 400 is the is the worst case depth stack value in bytes and 400 is also the the max stack usage by the system. You can see all other tasks are compared to the worst case as well in order to get the %. The amount of stack used by a function is determined by the combined size of the local variables defined in that function and not defined in the linker file.

    To modify the overall stack usage, please do it inside the ".cmd" file searching for the symbol --stack_size = _____

    Hope this helps clarifying the views.

    BR,

    David.

  • Hi David,

    Thanks for the clarification. I still think the way the Stack Usage view called out is misleading. If I am told "400 out of 400 units used (100%)" and I then add 2 units to the stack, I would expect a stack overflow condition instead of "402 out of 402 units used (100%)".

    Can you clarify why the C system stack size input in the linker settings is a different value again and why changing it has no effect?

    Regards,
    Jamie

  • Hello Trackert,

    The value defined at the linker command file ".cmd" overwrites the stack flags defined at the linker settings. However this is because of the command line-pattern, if you modify the order so that ${flags}  is at the end, then you should be able to see a modified stack size based on the GUI value you set.

    command line-pattern: ${command} ${output_flag} ${output} ${inputs} ${flags} 

    BR,

    David

  • Hi David,

    Thanks, I marked this resolved but I think the answers just confirm that CCS is a convoluted mess. You need to know the low-level details in order to use / interpret the GUI which in turn renders the GUI redundant. 

    I previously attempted to move the implementation to the command-line, but the tooling (XDCtools in particular) is too intertwined with CCS to make this practical. It is also not possible to use Theia with the CC2640R2F device (and I don't know if Theia resolves these issues anyway). 

    Regards,
    Jamie