Tool/software:
While debugging Local variables shows 0, or 'no location, value may have been optimized out'
How can I see the values ?
CCS 20 on Windows 10
Version: 20.1.1.8__1.7.1
Default VS Code API: 1.92.2
XDS110 debugger
This thread has been locked.
If you have a related question, please click the "Ask a related question" button in the top right corner. The newly created question will be automatically linked to this question.
Tool/software:
While debugging Local variables shows 0, or 'no location, value may have been optimized out'
How can I see the values ?
CCS 20 on Windows 10
Version: 20.1.1.8__1.7.1
Default VS Code API: 1.92.2
XDS110 debugger
Hello Itamar Cohen,
I hope you are doing well. We can try changing the optimization level of the local project (right click on the project, go-to properties and under the Arm Compiler click on Optimization) from default "z" to "0"; which should remove the optimization, this will make your project larger though.
Thanks,
Alex F
Hi Alex
This really helped.
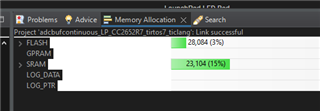
Is there a way to see how much Free/Used RAM and Flash the project consume ?
Thanks
Hello Itamar Cohen,
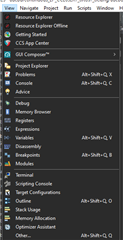
Yes, click on "view" and then on "memory allocation"


Thanks,
Alex F