


Hello:
The customer is currently using TI's CC2540 for their tracker project and has encountered the following issues while scanning in master mode,
The customer's original question is as follows:
1.In our office environment (with over 100 Bluetooth devices around), I often encounter CCU being unable to scan and report beacon information within 15 seconds,
even if the beacon pin is right next to the CCU.
In environments with high levels of Bluetooth, there may be situations where the target device cannot be scanned for a long time, and even if it is very close, it is often not scanned within 15 seconds.
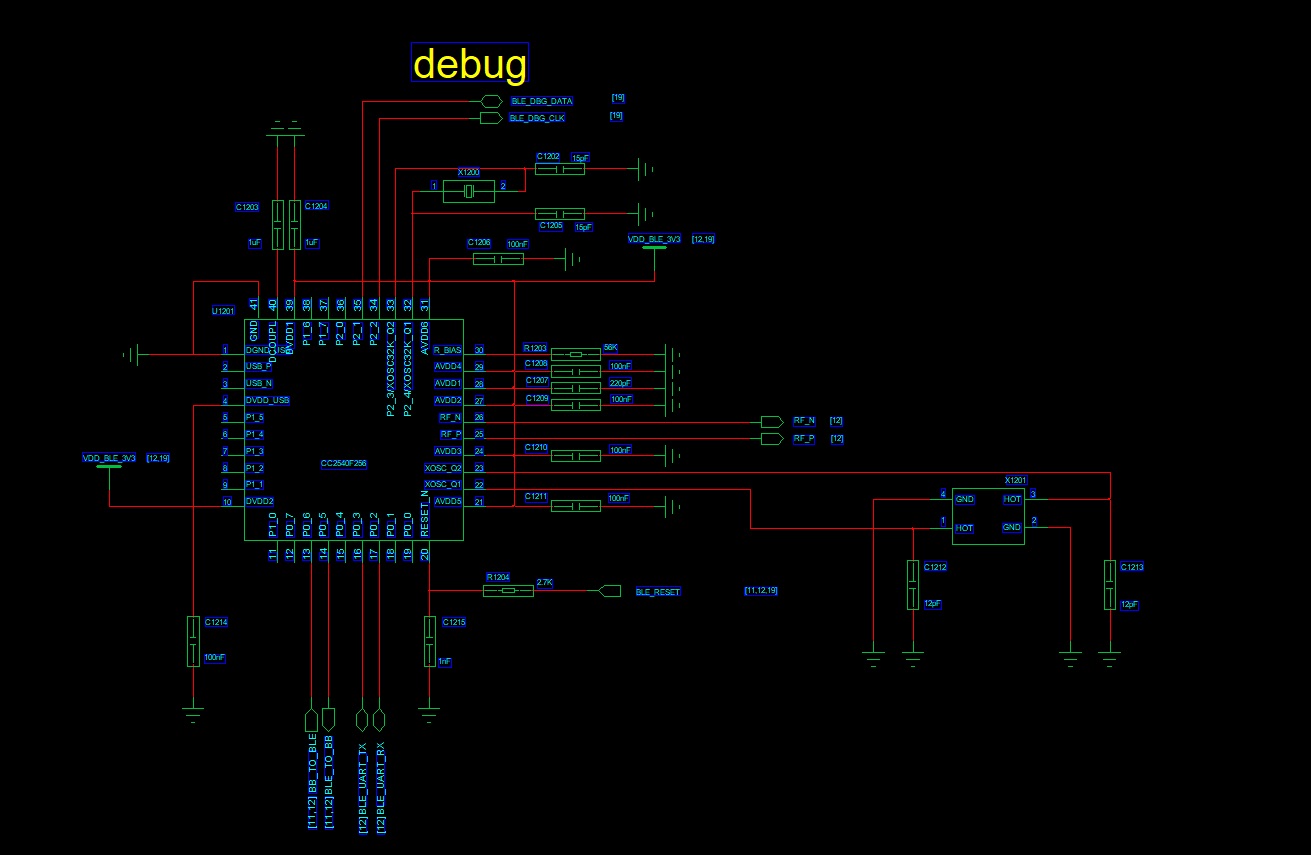
The schematic diagram is as follows:
The test data is as follows:
|
|
|
|
|
|
|
|
|
|
|
|
|
ble scan ibeacon test data |
Time taken to scan the target iBeacon |
|
|
|||||
|
Version |
scanning cycle |
Scan Window |
scan interval |
0-1 |
1 - 2 |
2 - 3 |
>4 |
The longest time it takes to find the target iBeacon in a single search |
The total number of times the target iBeacon has been scanned |
|
Old version filtered broadcast |
350ms |
default |
default |
85609 |
8810 |
2098 |
824 |
14 |
97341 |
|
New version, unfiltered duplicate broadcasts |
1000ms |
500ms |
500ms |
163086 |
13302 |
1733 |
240 |
6 |
178361 |
|
2000ms |
500ms |
500ms |
69408 |
7098 |
1204 |
379 |
8 |
78089 |
|
|
3000ms |
500ms |
500ms |
45129 |
4158 |
774 |
210 |
15 |
50271 |
|
|
4000ms |
500ms |
500ms |
45322 |
4077 |
540 |
101 |
6 |
50040 |
|
|
5000ms |
500ms |
500ms |
8222 |
1022 |
518 |
4068 |
26 |
13730 |
|
|
|
|
|
|
|
|
|
|
|
|
|
|
|
|
|
|
|
|
|
|
|
|
The percentage of testing times in each time period to the total testing times |
|
|
|||||||
|
Version |
scanning cycle |
Scan Window |
scan interval |
0-1 |
1 - 2 |
2 - 3 |
>4 |
|
|
|
Old version filtered broadcast |
350ms |
default |
default |
87.94% |
9.05% |
2.16% |
0.84% |
|
|
|
New version, unfiltered duplicate broadcasts |
1000ms |
500ms |
500ms |
91.43% |
7.46% |
0.97% |
0.13% |
|
|
|
2000ms |
500ms |
500ms |
88.88% |
9.09% |
1.51% |
0.49% |
|
|
|
|
3000ms |
500ms |
500ms |
89.77% |
8.27% |
1.54% |
0.41% |
|
|
|
|
4000ms |
500ms |
500ms |
90.54% |
8.18% |
1.08% |
0.20% |
|
|
|
|
5000ms |
500ms |
500ms |
59.88% |
7.44% |
3.77% |
29.62% |
|
|
|


