This thread has been locked.

If you have a related question, please click the "Ask a related question" button in the top right corner. The newly created question will be automatically linked to this question.

CC2640: Debugging during OAD CC2640 custom board

Part Number: CC2640


CC2640 4x4 custom board, ble_sdk_2_02_01_18, TI RTOS 2.20.1.08,

BTool v1.41.16, CCS6.2, XDS200 debugger.

I am running clean copy of simple_peripheral on the custom board.

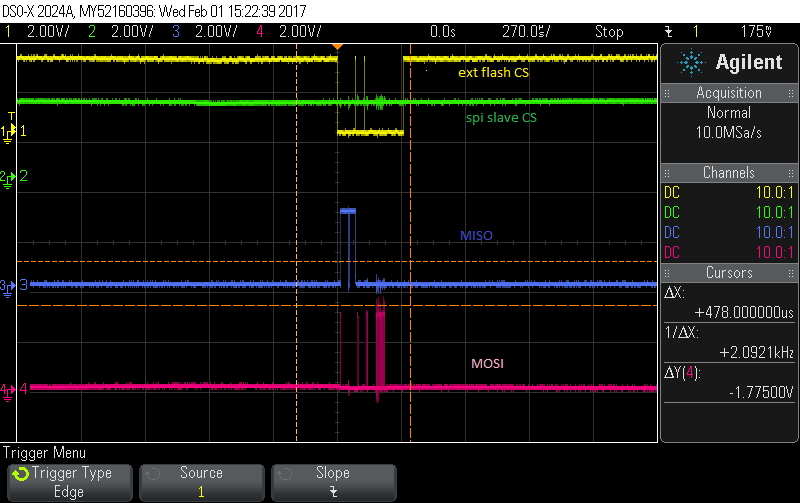
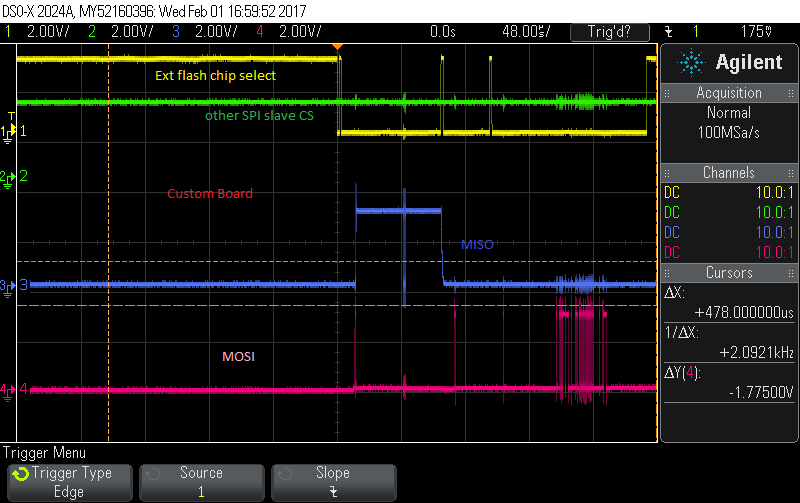
I am probing two SPI chip select pins, MOSI and MISO on the scope.

1. The scope shows the external flash chip select is the only one going

active during the entire OAD.

2. The BLE sniffer is showing several successful block response captures.

The sniffer crashes before the max block count ends (screenshot attached).

3. All custom board pins are set correctly and CCS board file links open up

the custom board file.

4. BTool shows the entire block count being sent out, but in the end I get an

OAD not successful message. A CRC error is shown as the OAD status.

(BTool Log file attached).

I have a CC debugger that can be used with the sniffer. Is there a way to debug

when an OAD is in progress? Where can the problem be happening? Since this

error happens without even the application's use of the SPI driver, any custom

board set up issues have to be ruled out ASAP.

Please help.

Thanks,

Priya

OADFeb12017CleanSP.txt

  • It certainly sounds like an issue with your board configuration since you're not seeing any activity on MISO / MOSI. I would set a breakpoint during the first SPI write and step through the function to see what is happening.
  • THERE IS ACTIVITY ON THE MISO/ MOSI AS PROVEN ON THE SCOPE.

    Why are you assuming there is no activity?

    Can there be a more insightful response?


  • HOW TO SET BREAKPOINT DURING OAD? NO ONE IS ANSWERING THIS QUESTION.

  • Well you stated "The scope shows the external flash chip select is the only one going active during the entire OAD." So this appears to be a contradiction.

    In any case, you have a golden example to compare against in the simple_peripheral project included with the installer. You can take sniffer captures and logic traces of the standard simple_peripheral and compare this to your project to see where the difference lies. Once you find this difference, feel free to post it here and we can recommend further debugging steps.

    Regarding setting a breakpoint during OAD...this is no different then setting a breakpoint at any other time. See the breakpoint section of the SDG for details on how to set breakpoints: software-dl.ti.com/.../ble-debugging.html
  • I meant to say the only active SPI CS. In recent threads, I was having multiple SPI

    chip selects. I would have definitely reported no activity on MOSI/MISO had I not

    seen any.

    I have the debugging information suggested.

    • At initial glance, the sniffer logs don't seem different for the out of the box demo

       and the custom board (logs attached).

    • The custom board responded to a breakpoint at oadBlkNum++ in the following

                 section in oad.c pasted below.

                The out of the box demo never halted at this breakpoint though the debugger

                 showed this breakpoint was active.

    • The scope picture for the out of the box demo shows no activity on the MISO pin,

                whereas the custom board does. The custom board pin default definition is different.

                Changing this default value in the custom board did not change the MISO pin activity

                on the scope during OAD.

    Not sure if this experiment revealed anything. Let me know what you think. The custom board

    seems to have trouble in the very end of the OAD.

    Thank you,

    Priya

    const PIN_Config BoardGpioInitTable[] = {

    Board_SPI0_MISO   | PIN_INPUT_EN | PIN_PULLUP | PIN_HYSTERESIS,

    void OAD_imgBlockWrite(uint16_t connHandle, uint8_t *pValue)

    {

     // N.B. This must be left volatile.

     volatile uint16_t blkNum = BUILD_UINT16(pValue[0], pValue[1]);

     // Check that this is the expected block number.

     if (oadBlkNum == blkNum)

     {

       // Write a 16 byte block to Flash.

       OADTarget_writeFlash(imagePage, (blkNum * OAD_BLOCK_SIZE), pValue+2,

                            OAD_BLOCK_SIZE);

       // Increment received block count.

       oadBlkNum++;

     }

     else

    snifferLogCustomBoardOAD.psdSnifferLogOADLP.psd

  • I have been using this approach in combination with system_printf and
    the scope to debug OAD with the custom board.

    The custom board is not reading from the external flash during OAD.
    OAD_WRITE_IDENTIFY_REQ event happens, and inside OADTarget_getCurrentImageHeader,
    the external flash opens successfully.

    The external flash is 256 kB. Is it possible the external flash is getting the
    incorrect address? What should this value be set to inside ext_flash_layout.h?
    #define EFL_ADDR_META 0x78000

    I have also tried #define EFL_ADDR_META 0x1C000


    Where in the simple_peripheral_lp_app.map file can I find this start address?

    Thanks,
    Priya