This thread has been locked.

If you have a related question, please click the "Ask a related question" button in the top right corner. The newly created question will be automatically linked to this question.

RTOS/CC2640R2F: Heap Issue: CC2640R2 based TI custom peripheral devices is not able to pair with iOS device and an android device together

Part Number: CC2640R2F
Other Parts Discussed in Thread: BLE-STACK

Tool/software: TI-RTOS

We have developed a project based on the "Multi-Role" example out of the SDK v1.50. This software is developed for our custom CC2640R2 based BLE device configurable as either central or peripheral.

While in peripheral mode, our device is allowed to connect with maximum of two central devices. Although, we had an issue connecting and pairing to even one of the central devices, later we found that the heap memory was falling short. (discussion on this is here)

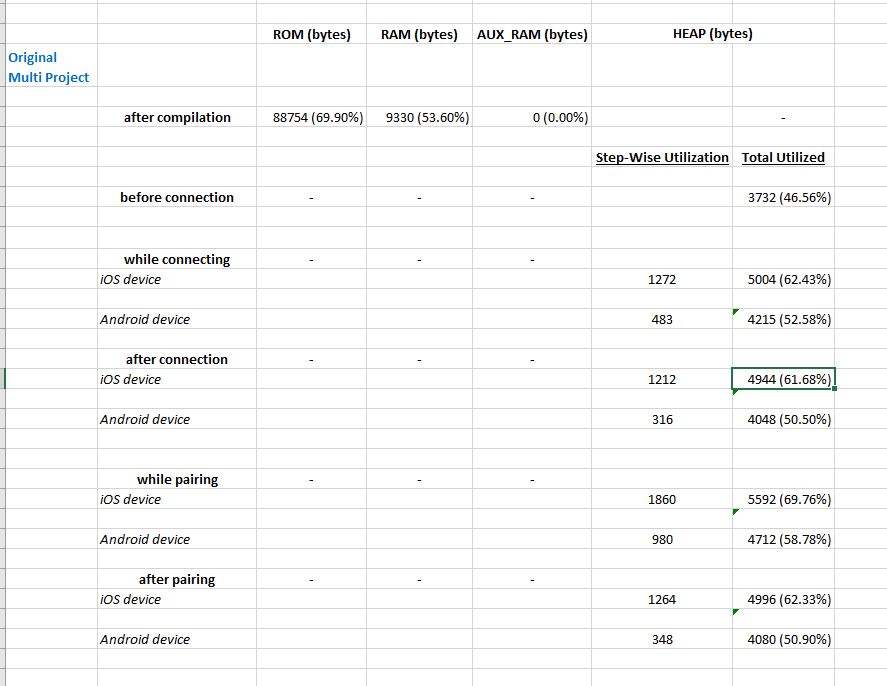
After the inclusion of AUX ram into the SRAM, we were able to increase the heap by approximately 2KB and got the iOS device and the android device to connect and pair individually. But, connecting the iOS device and android device in succession, in any order, resulted in failed pairing of the later. From detailed inspection of the heap usage statistics it was found that the iOS device requires nearly 2.5KB of heap to successfully connect and pair and similarly the android device requires nearly 1.2KB of heap. So, the heap memory available was not enough to sustain both the connections simultaneously.

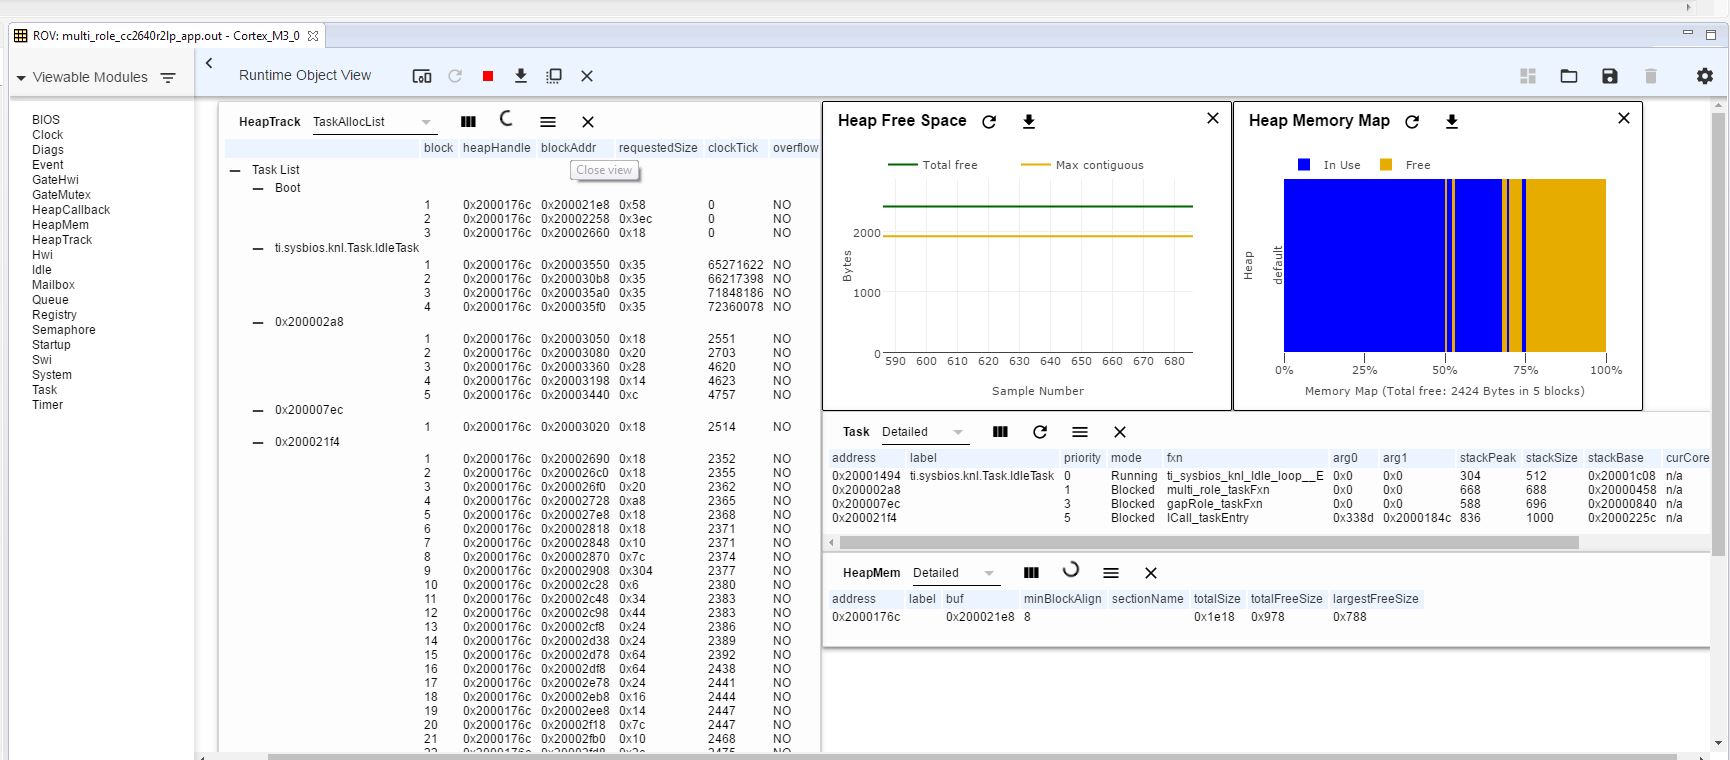
We want to know how the heap usage of a connection is distributed (for both iOS and Android connections). This would enable us to reduce the heap usage, if possible, and more importantly decide our device's limitations (in terms of number of connections, etc.) to avoid unprecedented scenarios.

Thanks and Regards.

  • Hello Amod,

    We do not have an exhaustive list of the amount of heap used by a pairing session for all possible configurations.
    As you have observed, this can vary quite a bit based on the device, its BLE version, its IO caps, and the pairing mechanism that is ultimately chosen by the pairing negotiation.

    Do you have an idea of which pairing methods you would like to support so that we can assist you in bench-marking it in your system?

    Some of the major factors of heap used by a connection:
    - allocation of connection structures, this is constant
    - allocation of LL PDUs based on data length extension. This is dependent on the negotiated PDU size at the link layer/ the use of the data length extension feature
    - allocation of RAM workzone needed by LE Secure connections pairing.
    - dynamic allocation inside stack related to application initiated procedures such as GATT transactions, etc.
  • Sean,

    Thanks a lot for that information.

    Our BLE peripheral device is based on the "Multi-Role" example out of the SDK v1.50.
    We have kept most of the connection settings as the same. Here are a few settings we would like to highlight:

    1. The pairing setting of the peripheral device is kept like this:
    pairMode = GAPBOND_PAIRING_MODE_INITIATE
    mitm = TRUE
    ioCap = GAPBOND_IO_CAP_DISPLAY_ONLY
    bonding = FALSE

    2. The MTU size is negotiated as 65 for each connection. Also, the PDU size is maintained as 69. (as in the original "Multi-Role" example )

    3. The GATT profile has characteristics of maximum 2bytes and about 30 such characteristics.

    4. The peripheral can connect to 3 central devices, which can be an iOS, Android, TI central (based on the "Multi-Role") device.

    Please help us estimate the maximum and minimum heap sizes and its approximate distribution, required in the peripheral, for connecting to various types of central devices mentioned above.
    We could share any other settings details that you would require for estimation.


    Thanks and Regards.
  • Hello Amod,

    I cannot provide exact max and minimum heap sizes, we require that these must be obtained on the final product through interoperability testing with all supported peer devices across all versions. The bench marking is ultimately up to the end developer.

    However, what I can help you with is exactly how to get these metrics and benchmarks.
    As per our software developer's guide, the heap can easily be instrumented using the HEAPMGR_METRICS define.
    Please refer to the Debugging section of dev.ti.com/.../


    On each connection there are three major factors that contribute to heap utilization.
    - Control produces/negotiations such MTU size or Data length extension PDU exchange
    - Service discovery
    - Pairing

    When it comes to heap debugging the following parameters are important, each time I refer to "logging heap stats" below I mean storing these values in a way such that they can be extracted from the device after or during a test.
    The variables of interest are: heapmgrBlkMax, heapmgrBlkCnt, heapmgrBlkFree, heapmgrMemAlo, heapmgrMemAlo, heapmgrMemFail

    1. First benchmark the cost of each connection for each of your supported devices. This is best to be done with pairing off, it will give you an idea of the heap needed for each of the first two points above. Set instrumentation code in SimpleBLEPeripheral_processStateChangeEvt::GAPROLE_CONNECTED to log the heap stats. Continually increase the number of devices that you connect and observe the cost on the heap. Here it would be good to study what devices are the most heap intensive to connect to (i.e. consume the most heap on connection due to control procedures, service discovery methods, etc).
    Out of all the mobile devices you plan to support, find the one that is most heap intensive. Then scale testing with this device (or many copies of this device) to determine the max number of connections you can achieve with this device in your system

    This should give you a baseline of the heap consumed by just connection and performing service discovery.

    2. Add pairing and bonding into the mix. Do a similar study where you log the heap utilization on GAPBOND_PAIRING_STATE_COMPLETE, GAPBOND_PAIRING_STATE_BONDED, and GAPBOND_PAIRING_STATE_BOND_SAVED
    Determine which of the devices is consuming the most memory due to its supported pairing configuration. Compare this against the heap benchmarking performed with this device with pairing disabled.

    Steps 1-2 above should give you a good picture of what each operation costs on which device and will hopefully shed some light on what can be supported.
  • Sean,

    Your detailed explanation on how to estimate heap utilisation was very useful. We were able to log the heap usage metrics for several central devices, when they would connect to our peripheral device. The heap usage at various instances of connection and pairing could be found out using the methods you described above.


    To have a comparison for our statistics we also profiled the original "Multi_Role" example as an peripheral.

    The heap usages were such for an iOS device:

    1. 3732bytes out of 8016bytes before any connection

    2. 4944bytes out of 8016bytes after single connection

    and so on... (refer excel sheet excerpt for details)

    We wanted to analyse the distribution of the used heap (like MTU&PDU related usage, services&char. related usage etc.) at various instances (like before connection, after connections, etc.).

    For this we tried using the ROV debug plugin, on the original "Multi_Role" example as an peripheral, but, although the heap usage displayed was well bifurcated but it didn't show for what purpose that heap was being utilized. Example: in below image the  distributed heap utilization for iCall_taskEntry  (0x20002114) is provided but we don't come to know exactly for what these heap uses are happening.


    Is it possible to get such detailed information regarding the heap utilization? 

    We are seeking these answers so that we can theoretically estimate the heap use for a particular type of connection and also curb/reduce the heap usage if possible.

    Thanks and Regards.

  • Hi Amod,

    Apologies in the delay while responding.
    Thank you for the detailed summary an investigation.

    I have reviewed your second inquiry about the heap. All allocations that originate from task handle associated with iCall_taskEntry are related to the BLE-Stack. These are allocations that the stack has done to perform core functionality of the stack.

    Unfortunately, there is no way to know much else about these allocations.
    At this time, the stack does not have a mechanism for logging where each allocation came from.
    However, the best estimate that we can provide is to collect and dump these metrics before each operation/command to the stack to understand how much heap this uses. Of course, this is not an exact measure interrupts/preemption can always occur between measurements, but it should give you a pretty good picture of what operations are consuming heap.