Tool/software: TI C/C++ Compiler
Hi R.M
this is Leison . here one concerns need your help regarding the AoA packet sampling sequence diagram.

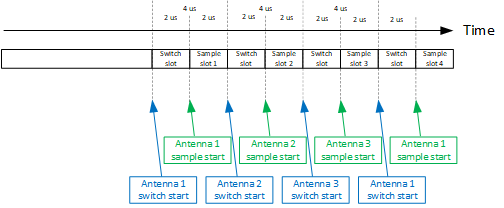
above diagram is my understanding for the IQ capaturing diagram .
1.Black draw is the theory time line for every switch when the AoA toggling.
2.Blue draw is the actual time line for every switch when the AoA toggling . and the switch settle down time is accomplished within the 400ns ( DMA9 trigger to GPIO registor 's time). and this 400ns is also included in the every 4us sampling time ?
if my understanding is not correct .can you pls draw a clear understanding sampling sequence diagram ?
many thanks
Leison