This thread has been locked.

If you have a related question, please click the "Ask a related question" button in the top right corner. The newly created question will be automatically linked to this question.

RTOS/CC2640R2F: Code stops executing after around 24 hours. Debugging help needed!

Part Number: CC2640R2F
Other Parts Discussed in Thread: SYSBIOS, CC2640

Tool/software: TI-RTOS

Hello,

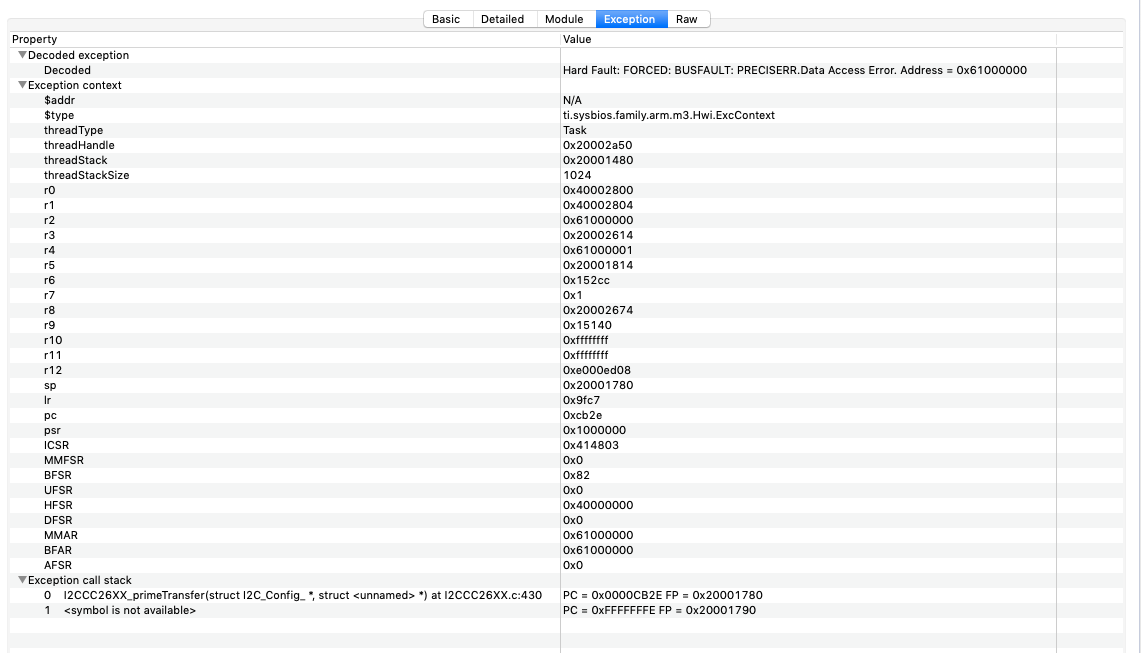
I am working on a TI-RTOS app for a new project. Things are progressing well, however after my code runs on the device for a a day or so it stops functioning. When it's connected to the debugger, if I pause, it always seems to be running code in ti_sysbios_family_arm_m3_Hwi_excHandler__I. But I am unable to see any stack traces.

The ROV->Task area says Received exception from ROV server: Target memory read failed at address: 0x20002ff0, length: 76. This read is at an INVALID address according to the application's section map. The application is likely either uninitialized or corrupt.

I've spent the last week or two trying to remove various parts of my code to determine what is causing the error, since so far at least I've been unable to take a more direct approach to debugging. By removing a call to one of my functions, the code ran for almost 72 hours until I stopped the test, which is about 3x longer than it usually runs. So I'm pretty confident that the issue is being caused by that function call. The suspect function is relatively simple. It makes a couple of GPIO_write calls, sets up I2C if it isn't already, and then sets up a number of I2C_Transactions and executes them with I2C_transfer(). It also uses Task_sleep to delay in a few spots. All of my other code is just really basic code that sets up the buffers and such, all with local variables. No mallocs or anything, so it's hard for me to suspect any of that causing such an issue.

I'm really at a loss after trying to sort this out for over a month. The rest of our product is just about ready to go into production and this is going to be holding up the entire pipeline. I'd really appreciate any debugging assistance possible. Right now, I'm running mostly blind in terms of the debug tools, which is particularly bad when the problem typically takes over 24 hours to manifest. We'd also be happy to pay for direct one-on-one support if such an option exists.

Thank you.

  • Hi Nick,
    Which SDK version are you using? Have you reviewed this chapter in the users guide;
    dev.ti.com/.../debugging-index.html
  • Thank you for your reply.

    I had been using 2.40.00.32, but just noticed that 3.10.00.15 has been released, so I am upgrading to that now.

    I have read that document in the past, but will review it today and reply with any progress or questions afterward.

    Thanks again.

  • OK, I reviewed the video and documentation at the link and it was helpful in getting additional ROV functionality working. However, after running my code for several days, it just froze again, and unfortunately, while Bios->Scan for Errors finds the following:

    ti.sysbios.family.arm.m3.Hwi, exception, An exception has occurred!
    ti.sysbios.knl.Clock, N/A, Caught exception in view init code: "Caught exception in view init code: "/Applications/ti/xdctools_3_50_07_20_core/packages/xdc/rov/StructureDecoder.xs", line 518: java.lang.Exception: Target memory read failed at address: 0x200037c8, length: 32This read is at an INVALID address according to the application's section map. The application is likely either uninitialized or corrupt."

    And Hwi->Module has exception = Yes, but unfortunately the exception tab is now back to a similar message as before:

    "Received exception from ROV server: Target memory read failed at address: 0x20002f50, length: 76. This read is at an INVALID address according to the application's section map. The application is likely either uninitialized or corrupt."

    Any thoughts? Thanks in advance!
  • Hi Nick,

    Those memory areas aren't really invalid, so please try to follow the instructions at dev.ti.com/.../debugging-index.html which is a workaround that tells ROV that the entire RAM is valid.

    In some configurations (auto-sized heap especially) the ROV isn't aware that the heap is a real memory area and tries to be clever and give you a warning.

    Best regards,
    Aslak
  • Hi Aslak,

    I'm assuming you mean the changes to package.xs, right? Adding the section from 0x20000000 to 0x20005000? If so, I already have that fix in place. I didn't have it prior to my first message, and adding it made ROV seem to start working properly. But once my firmware threw an exception now I'm still getting that same INVALID address error.

    Thanks for your help.

    Nick
  • Hi Nick,

    That is .. odd. However, ROV isn't the only game in town. You can also look at the registers in the NVIC (CPU_SCS in CCS), particularly CFSR to tell you the type of exception, and the BFAR register in case BFARVALID is set to tell you what address was improperly read or written to.

    You could try to use configure the heap with a fixed size too to see if that gets around the error message problem, just configure it with the same size or thereabouts as HEAPMGR_SIZE is currently. You'll want to replace the import statement at the bottom of app_ble.cfg with the contents of the file at source\ti\blestack\common\cc26xx\kernel\cc2640\config\ble_stack_heap.cfg and then change HEAPMGR_CONFIG and _SIZE.

    Best regards,
    Aslak
  • Ok thanks. Unfortunately I wasn't able to get the CFSR from that test as it reset for some reason during the debugging process. However, I think I maybe realized why the ROV issue returned. Before making changes, I created a backup copy of the entire simplelink tree next to the original. For awhile CCS was using the correct version, but I think during a restart or something it switched to the copy, which didn't have any of my changes in it. I noticed this now while doing a clean and rebuild which threw a macro error because of spaces in the pathname (because of " copy" added to the end by OSX).

    So now I have moved that copy elsewhere, restarted CCS, and it's back on the proper simplelink directory with my changes. For the moment at least, BIOS->ScanForErrors is showing no errors. So I'm going to setup the test again and let it run. I'll update when it breaks again, hopefully with some ROV exception data.

    In case I need to move to a fixed size heap, where exactly do I find HEAPMGR_SIZE? I've looked about and haven't been able to find it yet.

    Thanks again!

  • Hi,

    In app_ble.cfg under TOOLS in your project you will find a line at the bottom looking a bit like utils.importFile("common/cc26xx/kernel/cc2640/config/ble_stack_heap.cfg");. Replace this with the contents of the file that is being imported, and inside that file find the lines var HEAPMGR_CONFIG = 0x80; and var HEAPMGR_SIZE = 0x00; and change them.

    Best regards,
    Aslak
  • Thanks. Sorry I wasn’t clear. I’ve found those in the cfg file, but how do I know what fixed heap size I should use?

  • I see. Well you could type in "heapEnd", "heapStart" and/or just "HEAPMGR_SIZE" in the expressions view in CCS while you are debugging. The first two are also in the map file. Perhaps choose a number slightly smaller than this size.

    Best regards,
    Aslak
  • Aslak,

    OK, I have some good news. Finally after realizing the issue yesterday morning, I ran the code again and caught the exception in ROV (please see screenshot attached). It looks like a bad data access within an I2C call. My read and write buffers are just local variables created in the same function as the I2C_transfer calls, so I don't think that's the issue. See code here: https://gist.github.com/relevante/cf18858e3727ca8ac644080b274b8641.

    I also checked all of my stacks, and the Hwi stack is sized at 1024 and has a peak of 480. None of my other stacks have overflowed either. They all have at least 216 bytes of headroom between stackSize and stackPeak.

    I'm sort of at a loss as to how to debug this further. I'll keep the firmware paused as-is in case you need more information from the debug session.

    Thanks again!

  • Hi Nick,

    Well that's good. The next step is to figure out precisely why the device is told to read from address 0x61000000 which doesn't exist. To do that you can find the Disassembly view and plot in the PC address from your picture. This should get you to the instruction after the offending one. At that point you can try to find out why R4 is set to 0x61000000, and I suspect this has to come from one of the input parameters to the primeTransfer function.

    You can also go to the address in LR in Disassembly to see who called the primeTransfer function. With any luck it's your own code and you can figure out why.

    It's possible that the stack trace becomes more helpful if you add the symbols for RTOS and for Driverlib.
    Run -> Load -> Add Symbols
    1. <SDK>\kernel\tirtos\packages\ti\sysbios\rom\cortexm\cc26xx\r2\golden\CC26xx\rtos_rom.xem3
    2. <SDK>\source\ti\devices\cc26x0r2\rom\driverlib.elf

    Best regards,
    Aslak
  • Aslak,

    Thank you very much. Unfortunately my computer appears to have rebooted to install some updates and I lost the debug session. I just restarted the firmware and have added the additional symbols. By Monday it will probably have crashed again and I'll let you know what I find after investigating your suggestions above. Thanks again and have a great weekend.

    Nick