


Part Number: CC2652P
I am trying to debug a device (CC2652P) that consists of a custom bootloader based on BIM and an additional application.
Using the CCFG the integrated ROM-Bootloader starts my custom bootloader on reset.
Eventually, my bootloader will jump to the application.
The bootloader and the application are individual projects in Code Composer.
Now I would like to be able to start a debug session and debug the application as well as the bootloader in the same session.
I tried to manually add the *.out file of the bootloader after starting a debug session of the application (Run --> Load --> Add Symbols).
I also tried it using a GEL script with the command: "GEL_SymbolAdd(...)"
The symbols seem to be added correctly as I can find the associated functions in the "Disassembly" view and I am able to insert breakpoints there.

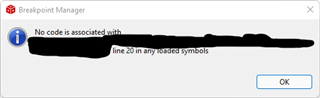
When I try to insert a breakpoint in the editor it shows a disabled (grey) breakpoint. When I try to enable the breakpoint in the "Breakpoints" view, an error message "No code is associated with .... in any loaded symbols" appears.
I want to be able to set breakpoints in the editor for the bootloader and the application project in Code Composer Studio.


