This thread has been locked.

If you have a related question, please click the "Ask a related question" button in the top right corner. The newly created question will be automatically linked to this question.

cannot connect with cc debugger on 2540 on own design

Other Parts Discussed in Thread: CC2540

Hi,


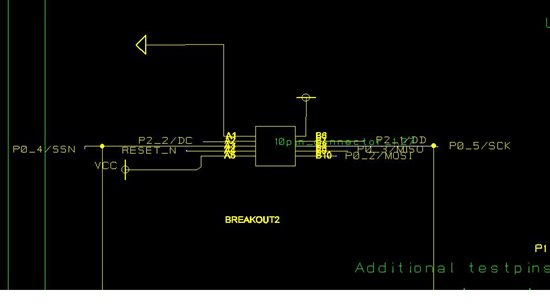
I created an own design with the 2540 but unfortunately I'm not able to connect with the debugger. It always shows a red led. I measured all the vcc pins and supply voltage ist correct on all pins, also is the connection to the debugger correct. When I measure the levels on DC and DD I see only around 0.45V compared to high levels (3.3V) if I do the same measurements on the usb-dongle kit sample.I checked the crystal (changed it even to go for sure) but still no change.

Any ideas what could be wrong or how I could measure what is wrong with my design?

Thank you in advance,

David

  • I have seen that communication sometimes fail due to long wires or poor soldering that distort the signals on the debug interface. You should also check that the CC2540 have good stable power.


    Tor-Inge


  • Hi


    Ensure that the ground pad soldered well.

    Also check whether VCC feedback connected from your board connected to the debugging

    cable. In other words check if those 5 signals from your board connected to debugging cable:

    1. VCC
    2. Ground
    3. DC
    4. DD
    5. Reset (preferably without any RC filter at this point).

    Br,

    Igor

  • Hi


    first of all thank you for your answers. I shortened the debugger cable and rechecked all the connection with my designs

    and could not find any errors. For the ground pad I do not really know how to check if it attached well to the solder. I did a

    reflow soldering and the solder leaked through the ground plate vias leaving some solder on the other side. I guess

    it must be connected thus finding no way how to check it.

    I'm still having 0.4V on DC and DD without having the debugger connected, the working sample has high levels.

    Debugger still keeps showing the red led. For the reset, it is well connected but I have the RC filter on my board. It would

    be difficult to bride the filter, do you think it might be the problem?

    Any further ideas on what I could check/measure or what I did wrong?

    br,

    David

  • Hi David,


    Ok, I don't know how exactly this filter interacts with reset, however

    it may prevent from the debugger to pulsate the reset while debugging,

    thus causing erroneous behavior of DC and DD signals.

    Can you please check the behavior of reset pin, while debugging, on

    working and non working versions of PCB.


    Br,

    Igor

  • Hi Igor,


    Working PCB:

    Reset_n with cc debugger connected: 3.3V

    Reset_n without cc debugger connected:3.3V


    Not working PCB:

    Reset_n with cc debugger connected: 3.3V

    Reset_n without cc debugger connected: 0V


    Should I bridge the RC filter? Thank you again for your help


    Br,

    David

  • Hi David,


    For the sake of experiment, remove all the passive parts connected to reset pin.

    Once all the passives removed, Is the reset pin floating now?.

    After doing so, try to debug again and see if the problem solved.


    Br,

    Igor

  • Hi Igor,


    unfortunately I had no chance. Removing the RC filter did not change anything. Any more ideas on how I could find out whats wrong with

    my design/pcb?

    Br,

    David

  • Hi David,


    Can you please post a schematics of the debugging part in your PCB.

    Thanks.


    Br,

    Igor

  • Hi Igor,


    hope you can see the picture. Pin numbers are not correct, but besides everything should be as in the reference design.

    Br,

    David

  • Hi David,


    The schematics seems alright.

    See what happens if you do the following experiment.

    1. Apply an external power (VCC) to your board
    2. Connect five wires to P10 on your board: A1, A2, A4, B6 and B7 pins
    3. Connect these wires to debugging connector A1->pin #1, A2->Pin#2
      and so on.

    Now, the led on the cc debugger turns green, or is it still red?


    Br,

    Igor

  • Hi Igor,


    first of all, thank you for your quick answers. It feels good to know that I'm not completely alone with my problems *g*

    As you suggested, I removed the additional connections of the connector but still no luck. LED ist still red.

    Br,

    David

  • Hi David,


    Do you have additional custom PCBs?

    Maybe the problem is with this specific SoC?


    Br,

    Igor

  • Hi Igor,

    I have two more pcbs which I need to reflow first. I wanted to find the problem first before producing more samples, but I guess there is no

    other way to exclude soc failure. I will post my results with the new pcbs but I assume this will take a while.

    Thank you again for your help,

    br,

    David

  • Hi David,


    One more thing to check, before you you are trying with other pcbs,

    let's verify that the cc2540 SoC works properly.

    Can you please check that there is a desired value of voltage on each AVDD and DVDD pin.

    Secondly, please measure the voltage on DCOUPL pin (#40), you should be measuring 1.8v.

    May be your device isn't supplied proparly or something else within the device gone wrong.


    Br,

    Igor

  • Hi Igor,


    I checked all the AVDD and DVDD pins, they are all correctly powered (3.3V) but the

    DCOUPL pin is 0V. I even deconected the 1uF cap to be sure its not a wrong part. But it stays

    at 0V. I guess the soc is bad, what do you think?


    Br,

    David

  • Hi David


    Three options here:

    1. SoC is bad.
    2. One of the digital VDDs cold soldered (the pad doesn't really soldered to the pin).
    3. The ground pad isn't soldered at all (which is not the case according you).


    Br,

    Igor

  • Hi Igor,


    i tried to resolder the dvdds  and again the ground plate with no result. I guess the soc is bad. I'll make a new pcb or exchange the

    soc, but I'm not sure if my soldering/heatgun skills will be sufficient to change a qfn-40 chip ;)

    Thank you so much for your help, I will come back on you once I changed the soc or made a new pcb

    Br,

    David

  • Hi Igor,


    it's been a long time but I promised you that I will come back on you and report my results. Finally we figuered out what the problem was. While doing the second pcb we discovered that our free stencil to apply the solder paste was faulty. Guess what, not all the pins of the soc very there. Unfortunately in the final pcb we could not see it since the pads had the same color. So many pins were not connected but when I measured I measured the pads (not very thin measuring needle). Now were able to flash and to program the chip. Anyways, many many thanks for your help and next time you are in south of germany send me an email and I'll pay you a beer or two *g*


    Right now we have the problem that in the IAR we can only set breakpoints if the debugger is stopped and once restarted the breakpoints appear on a different spot than originally placed. Any ideas how this can happen?


    Br,

    David

  • Hi David,


    Beer, sounds great, count me in... :)


    And now for a less pleasant part.

    It can be due to changes you make in the code while you still debugging.

    And there is more annoying thing, sometimes debugger stops in a different location

    (not where the break point set), it happens due to code optimization.


    Edit: One more thing, due to optimization of the code, unused variables or logically irrelevant

    parts of code [for example, the part of code under if( 1 == false ) condition] aren't available for

    setting break point, that is, you won't be able to set breakpoints in these parts of the code.

    Well, I don't know if it answers your question, but, if you'r experiencing some other issues with

    setting break points in compiler while debugging, let me know..


    Br,

    Igor

  • Hi Igor,


    nice - just make sure you put on your drinking pants ;)


    Hm, even without having altered the code no breakpoints are possible during active debugging. I sometimes see this error in the debug console "setting breakpoint not possible -driver error".


    Once the debugging is off it works but as written before it's roulette gambling style to predict where the breakpoint will come out. Is there a way to switch off code optimization?

    And again, thank you for your quick help.

    Br,

    David

  • Hi David,


    Well, I missed that part of setting breakpoints during active debugging, as I remember, it is not possible,

    you must pause the debugging process and then set breakpoints and  i'm pretty sure that you are not

    allowed to set more than 3 breakpoints at once.


    Regarding optimization, I'm not sure it is a good thing to switch it off (actually I'm not sure it's even enabled),

    but, one can disable optimization by opening "project options" (Alt+F7)->C\C++ compiler->Optimization and

    then choosing Level->None.


    Br,

    Igor