


Part Number: RF430FRL152H
hello, my name is minhyung.
I am using RF430FRL152H and MPS-EXP430G2ET + DLP7970ABP to create a custom board.
The RF430FRL152h custom board which operates with NFC is to receive the LED light by the light sensor and send the data to the master kit MPS-EXP430G2ET + DLP7970ABP and send it to the PC to display it. We were going to display the data in Matlab.
I succeeded in plotting graphs in real-time by receiving raw data with Matlab. However, I have an additional problem.
When the RED LED and the Infrared LED are blinking at the intersection, data is strange Each time RED and Infrared flashed, I thought I would get different raw data. However, unexpectedly, I got some strange raw data like the graph below. This is similar to the charge and discharge graph of the capacitor. Why does the graph look like this?
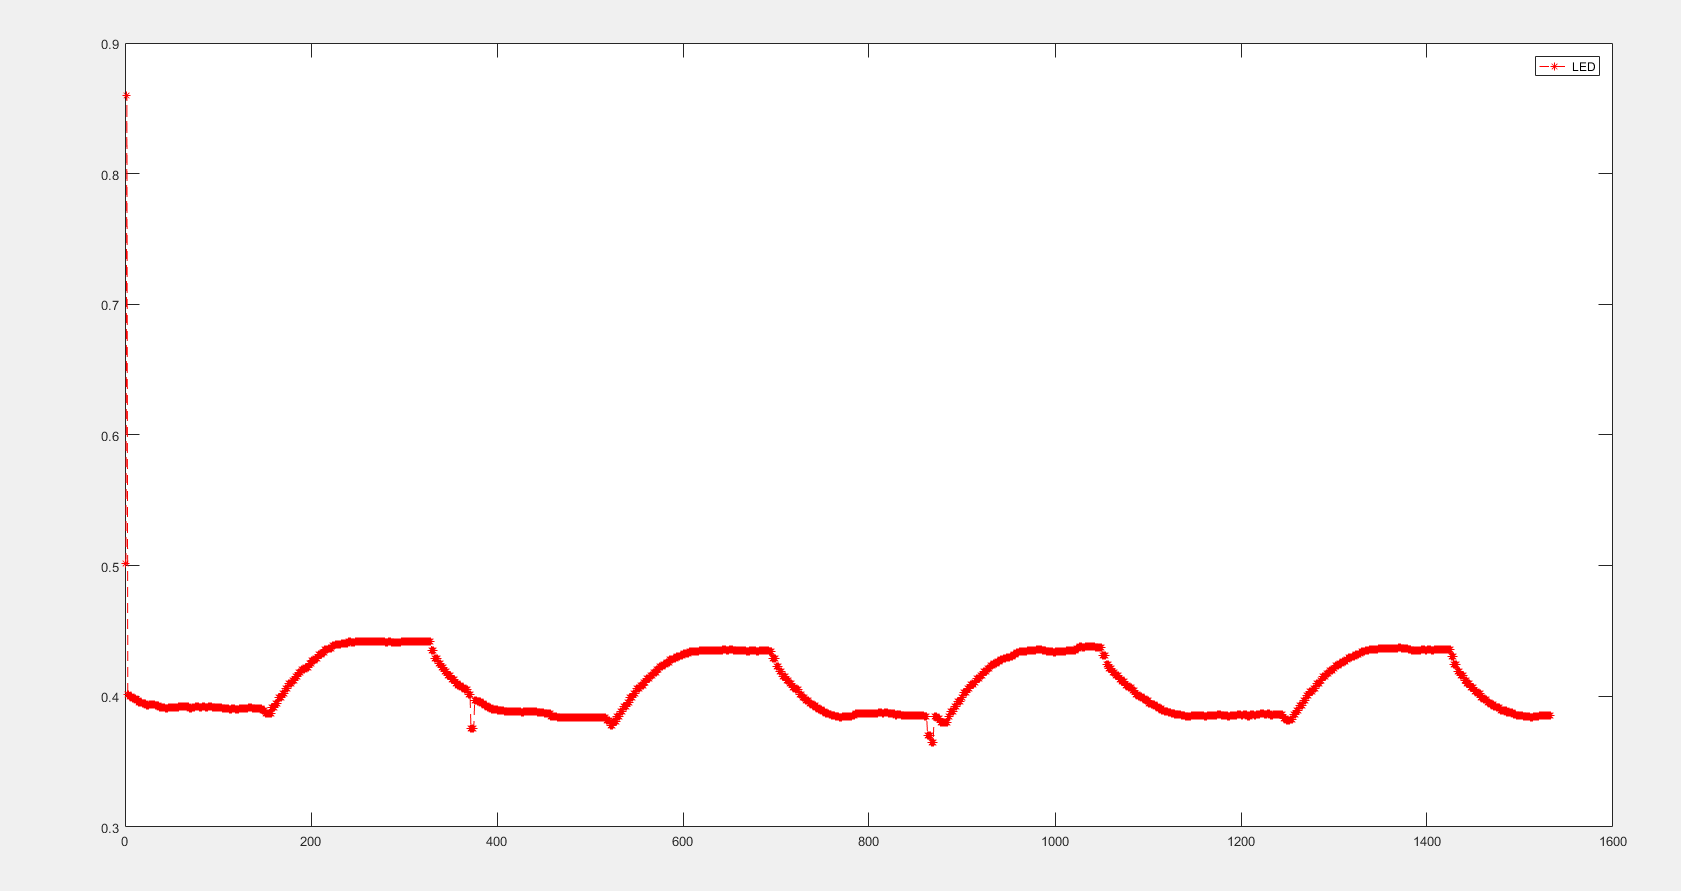
However, the novelty is that if we do not apply any light except the fluorescent lamp while the LEDs are turned on crossroads, We can get constant raw data as shown in the graph below.
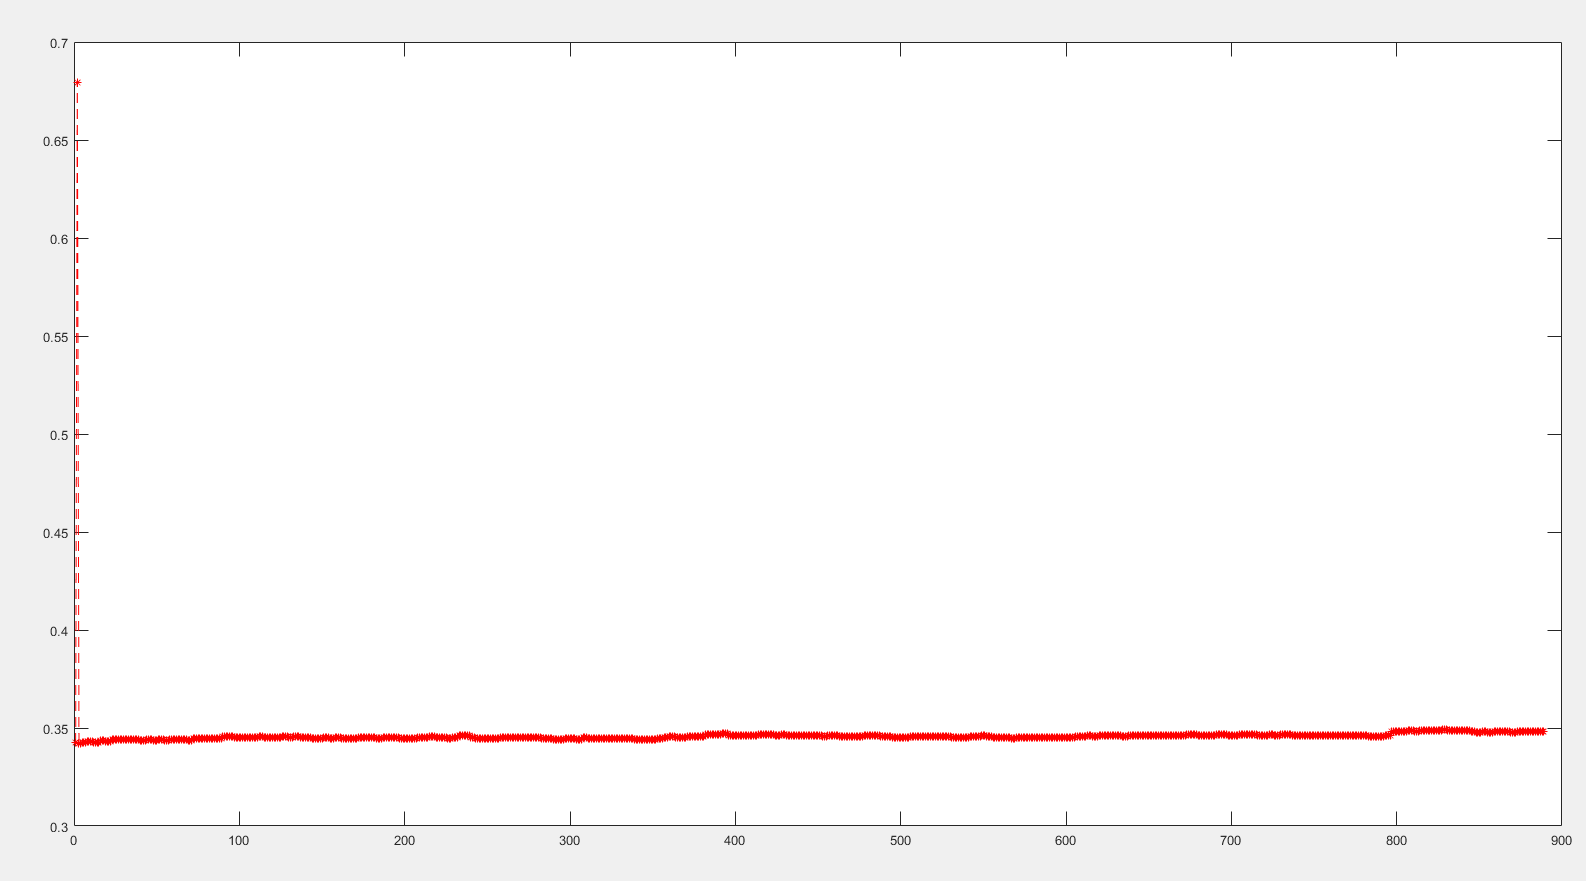
I want to solve the problem of the graph appearing strange. I'm currently trying to create a Pulse Oximetry. However, if this strange graph is derived, the oxygen saturation value cannot be obtained.
Finally, I have a question. For the raw data I get, the value is saturated at 0.5V, so no higher value can be obtained. Why is the value saturated at 0.5V? Is there a way to solve this?
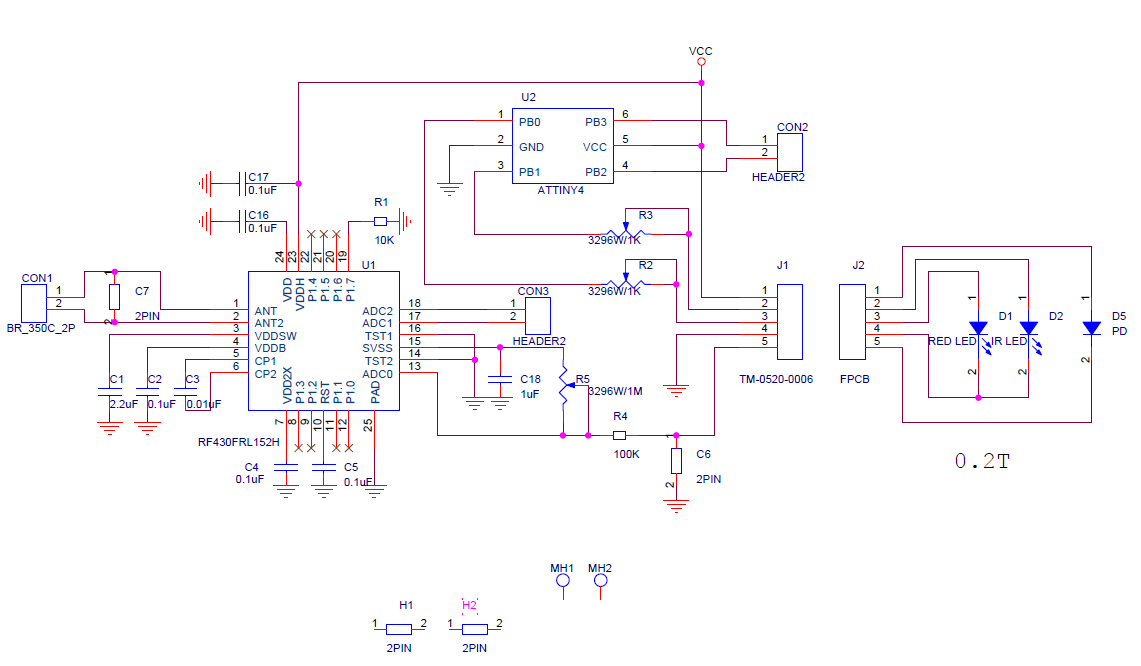
To help solve the problem, I've attached a schematic of my custom board.
Thank you.

