This thread has been locked.

If you have a related question, please click the "Ask a related question" button in the top right corner. The newly created question will be automatically linked to this question.

CC2530 Error Vector Magnitude

Other Parts Discussed in Thread: CC2530, CC2591

I am in the process of qualifying designs which use the CC2530.  Specifically of note, I am encountering Error Vector Magnitude measurements that exceed the specifications of the data sheet (2%) at full power (4.5 dBm) and +25C.  The problems get considerably worse at low temperature (-40C), where some degradation is expected due to the increase in output power.  The output power itself is within reasonable expectations, so I was curious if anyone could comment further on the situation.  I can provide more data if helpful.

To this end, I also decided to test the evaluation module with CC2591 front end, as one of the designs we are looking at utilizes this part.  The EVM exceeds the IEEE spec of 35% RMS EVM at cold temperature when the CC2591 is enabled at full power.  Backing the power down by one or two steps (to 2.5 or 1 dBm respectively) results in a substantially improved measurement, though this disagrees somewhat with the data sheet.  Even at room temperature, I cannot seem to correlate the measurements on either design, or the EVM.

I would be curious to know if any testing has been done at cold temperature, and what, if any, workarounds may be required to comply with the IEEE spec.

Thanks!


  • Hello Zap,

    Please do send some more information on the test results.

    You should also know that there might be slight difference from sample to sample (some operating corner is worse than others), that said we have seen very consistent results in the lab, and as you say you might experience a little bit higher EVM at cold due to higher gain.

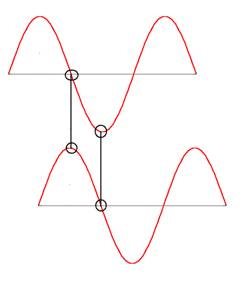
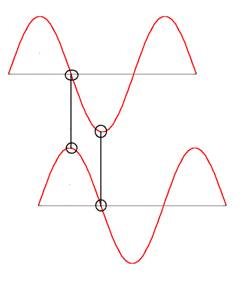
    That said it should also be noted that there are differences in how to measure EVM for a 802.15.4 signal (Offset QPSK ). For regular QPSK, the I and Q transitions of a symbol occur at the same time. This leads to a straight forward measuring approach; you simply measure the I and Q signal at the start of the symbol and compare them with their ideal counterparts. For OQPSK the Q transition are offset compared to an I transition within a symbol, if you then measure both the I and the Q at the start of the symbol will give a result based on one signal at it decision point and one at in the middle of a transition. For an ideal signal this doesn’t matter, but for spectrums where the I and Q signals are more noisy during transition then at their decision points this will lead to increased EVM.

    This latter method of EVM would not reflect how good the ICs are at receiving a signal, but rather how well it is compared to an ideal eye diagram, see picture below:

    We strongly believe that one should rather use a method called “offset EVM” when measuring the EVM. Offset EVM calculates the EVM for both the I and Q at the decision point and hence reflects the actual signal quality, see picture below:

    For some instruments offset EVM is not the default option for EVM measurements so one needs to change the setup of the signal analyzer.

  • Hi,

    Thanks for the response - we are actually taking measurements for both EVM and Offset EVM.  It appears that the falloff is very rapid, as reducing the output power goes from performance where the analyzer can't even lock the carrier to a very minimal Offset EVM.

    The data we have from the Evaluation Module (CC2530 + CC2591), full power:


    at 25C, 2405 MHz- 25.9% EVM, 10.6% Offset EVM

    at 25C, 2440 MHz - 23.9% EVM, 9% Offset EVM

    at 25C, 2480MHz - 14.8% EVM, 3.7% Offset EVM


    Our own boards (CC2530 + CC2591):


    at 25C, 2405 MHz - 17.5% EVM, 5% Offset EVM

    at 25C, 2440 MHz - 20.1% EVM, 6.5% Offset EVM

    at 25C, 2480 MHz - 16.7% EVM, 4.6% Offset EVM


    The greater problem comes when reducing to cold temperature, many times the analyzer cannot even lock the carrier, so the measurements may be questionable:


    TI Evaluation Module (CC2530 + CC2591), full power:

    at -40C, 2405 MHz - 61.4% EVM, 47.5% Offset EVM

    at -40C, 2440 MHz - 59.6% EVM, 46.9% Offset EVM

    at -40C, 2480 MHz - 30.4% EVM, 14.8% Offset EVM

    Our own boards (CC2530 + CC2591):

    at -40C, 2405 MHz- 60.6% EVM, 45.7% Offset EVM

    at -40C, 2440 MHz - 43.9% EVM, 29% Offset EVM

    at -40C, 2480MHz - 47% EVM, 36.7% Offset EVM


    From what I can tell, the numbers seem fairly close between our hardware and the reference board.  It should be noted that the reference board does exhibit a slightly higher power output, so I believe that explains its slightly higher EVM numbers, as well.

    The most interesting thing is that in both cases, the EVM plummets greatly with a one or two step reduction of output power level.  The constellation diagram moves around during high power, and is very stable when the power is dropped.

    I couldn't find the LO frequency stated in the data sheet, but I'm wondering if it sits at a harmonic of the fundamental, and if so, maybe it is getting back in and disrupting the stability of the system at higher power, since its magnitude would rise with a change in output power.  Any other thoughts, or suggestions are appreciated.

    Thanks!


  • Hi Zap,

    This is a little strange because we have tested this solution in the lab and did not experience such high EVM, please note that the highest recommended power setting for this solution is TXPOWER=0xE5 when connected to 50 ohms. Please see the following application note for more details: http://focus.ti.com/general/docs/lit/getliterature.tsp?literatureNumber=swra308a&fileType=pdf

    /delete