


Other Parts Discussed in Thread: Z-STACK
Hi everyone.
I working on Zigbee IoT device prototype, based on z-Stack library with CC1352 chip. My working setup looks like following:
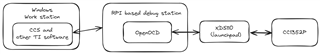
And I meet following issue:
* In case if project was build by GCC compiler, everything file and debugging works like a charm.
* In case if project was build by IT Clang compiler, debug does not work. Here is output from OpenOCD server side:
Open On-Chip Debugger 0.12.0
Licensed under GNU GPL v2
For bug reports, read
        http://openocd.org/doc/doxygen/bugs.html
Info : Listening on port 6663 for tcl connections
Info : Listening on port 4443 for telnet connections
Info : XDS110: connected
Info : XDS110: vid/pid = 0451/bef3
Info : XDS110: firmware version = 3.0.0.25
Info : XDS110: hardware version = 0x002b
Info : XDS110: connected to target via JTAG
Info : XDS110: TCK set to 2500 kHz
Info : clock speed 1000 kHz
Info : JTAG tap: cc13x2.jrc tap/device found: 0x3bb4102f (mfg: 0x017 (Texas Instruments), part: 0xbb41, ver: 0x3)
Info : JTAG tap: cc13x2.cpu enabled
Info : [cc13x2.cpu] Cortex-M4 r0p1 processor detected
Info : [cc13x2.cpu] target has 6 breakpoints, 4 watchpoints
Info : starting gdb server for cc13x2.cpu on 3333
Info : Listening on port 3333 for gdb connections
Info : accepting 'gdb' connection on tcp/3333
undefined debug reason 8 - target needs reset
Warn : Prefer GDB command "target extended-remote :3333" instead of "target remote :3333"
Info : JTAG tap: cc13x2.jrc tap/device found: 0x3bb4102f (mfg: 0x017 (Texas Instruments), part: 0xbb41, ver: 0x3)
Info : JTAG tap: cc13x2.cpu enabled
Warn : [cc13x2.cpu] Only resetting the Cortex-M core, use a reset-init event handler to reset any peripherals or configure hardware srst support.
[cc13x2.cpu] halted due to debug-request, current mode: Thread
xPSR: 0x01000000 pc: 0x00004a78 msp: 0x20013a00
Info : JTAG tap: cc13x2.jrc tap/device found: 0x3bb4102f (mfg: 0x017 (Texas Instruments), part: 0xbb41, ver: 0x3)
Info : JTAG tap: cc13x2.cpu enabled
Warn : [cc13x2.cpu] Only resetting the Cortex-M core, use a reset-init event handler to reset any peripherals or configure hardware srst support.
[cc13x2.cpu] halted due to debug-request, current mode: Thread
xPSR: 0x01000000 pc: 0x00004a78 msp: 0x20013a00, semihosting
Warn : keep_alive() was not invoked in the 1000 ms timelimit. GDB alive packet not sent! (1172 ms). Workaround: increase "set remotetimeout" in GDB
Info : JTAG tap: cc13x2.jrc tap/device found: 0x3bb4102f (mfg: 0x017 (Texas Instruments), part: 0xbb41, ver: 0x3)
Info : JTAG tap: cc13x2.cpu enabled
Warn : [cc13x2.cpu] Only resetting the Cortex-M core, use a reset-init event handler to reset any peripherals or configure hardware srst support.
[cc13x2.cpu] halted due to debug-request, current mode: Thread
xPSR: 0x01000000 pc: 0xfffffffe msp: 0xfffffffc, semihosting
Warn : keep_alive() was not invoked in the 1000 ms timelimit. GDB alive packet not sent! (1132 ms). Workaround: increase "set remotetimeout" in GDB
Info : Padding image section 0 at 0x0000616b with 1 bytes
Info : Flash write discontinued at 0x00006274, next section at 0x00057fa8
Warn : keep_alive() was not invoked in the 1000 ms timelimit. GDB alive packet not sent! (1613 ms). Workaround: increase "set remotetimeout" in GDB
Info : JTAG tap: cc13x2.jrc tap/device found: 0x3bb4102f (mfg: 0x017 (Texas Instruments), part: 0xbb41, ver: 0x3)
Info : JTAG tap: cc13x2.cpu enabled
Warn : [cc13x2.cpu] Only resetting the Cortex-M core, use a reset-init event handler to reset any peripherals or configure hardware srst support.
[cc13x2.cpu] halted due to debug-request, current mode: Thread
xPSR: 0x01000000 pc: 0x00004a78 msp: 0x20013a00, semihosting
Info : [cc13x2.cpu] only breakpoints of two bytes length supported
Error: can't add breakpoint: resource not available
In both cases was used ${ccs_install_root}\tools\compiler\gcc-arm-none-eabi-9-2019-q4-major\bin\arm-none-eabi-gdb.exe debugger. It looks like TI Clang does not have it's own debugger included.
And point here - zStack library shipped only for IAR and TI Clang compilers and do not have make files or any other build scripts to build it with GCC.
So, as result have following question: does projects build by TI Clang compiler can even be debugged using OpenOCD and some sort of GDB? If no, what is a correct way to do it? Maybe it possible to build zStack for GCC toolset?
Thanks, Alexander.
