This thread has been locked.

If you have a related question, please click the "Ask a related question" button in the top right corner. The newly created question will be automatically linked to this question.

RTOS/CC1350: Error handling with the error module and dedicated task in RTOS/sysBIOS, and testing

Part Number: CC1350
Other Parts Discussed in Thread: SYSBIOS,

Tool/software: TI-RTOS

I did some searching and can't find much in the way of a good description on how to implement what I want to do here, so it seemed worth asking in the community.

I'm trying to determine how to go about using the error module to catch spurious, unexpected, and difficult to diagnose hard faults/crashes and critical errors. My goal is to be able to extract error information (file, line, error type, etc) and store this to NVS so that I may do a soft reset of the system and allow me to extract the specific error details later.

I have created a high priority new task, ErrorHandlerTask, which pends on a semaphore so will sit idle until an error occurs.

In my release.cfg I have set my error policy as follows:

Error.policyFxn = Error.policyDefault;

Error.raiseHook = "&myErrorFxn";

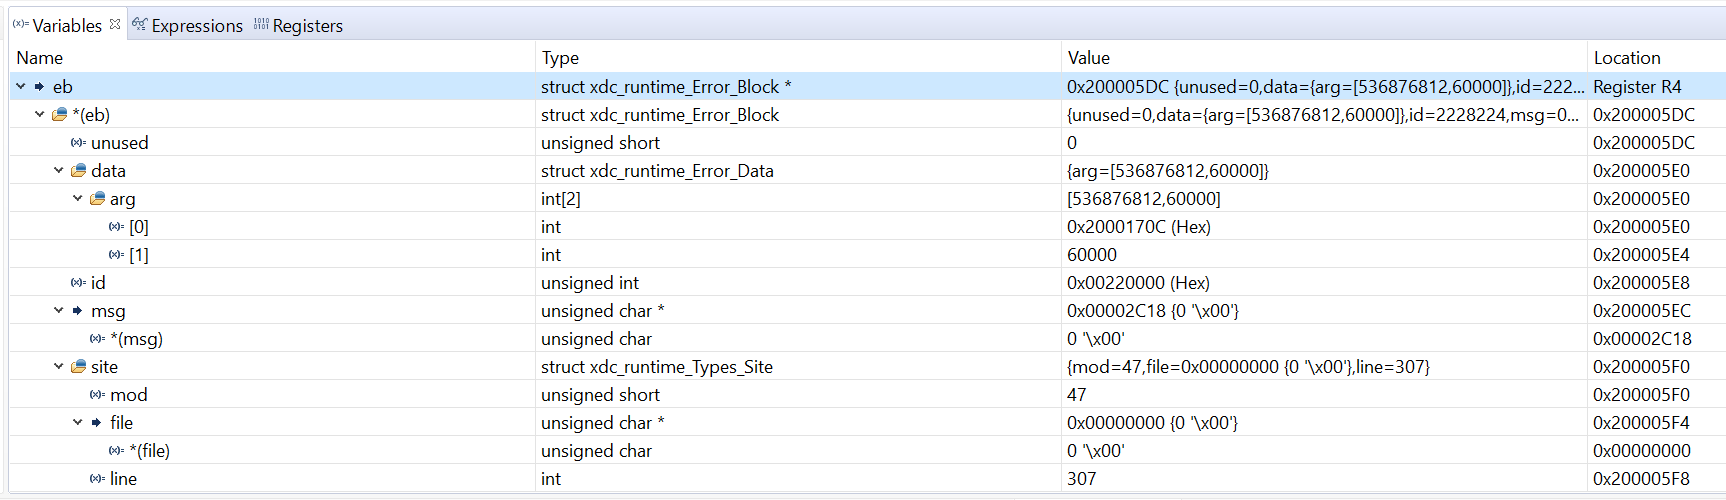
Within the same file as this task I have the myErrorFxn(Error_Block *eb). In this function I hope to extract the error information to some file global variables/structure and the post the semaphore to allow the task to process and store the details.

What I'm not sure I'm clear on is how the Error Module actually works. I've read a lot of the documentation, but it's all a bit convoluted and not very concise. As far as my understanding goes, with a the policyDefault set and my raiseHook defined, any error will trigger myErrorFxn and deliver a pointer to the Error Block. From here I can use the various error functions to extract information such as the file, line number, and error arguments. I don't use Error_Blocks in any of my functions, so I assume this is generated by the module when something like a hard fault occurs.

So my first questions:

  1. What type of errors will result in the error raiseHook being called?
  2. What information do the error arguments Arg0 and Arg1 provide?
    I can find plenty of mention of them, but not much in the way of description of what they represent.

Once I have figured out how to extract and quantify the information from the Error_Block I will need to test it. So my next question:

  1. What methods can I use to generate a variety of genuine errors/faults which will allow me to test the functionality of this error handler?
    i.e. What commonly will break TI RTOS?

I've not doubt I will have some follow-up questions, but for now I hope these will get me moving in the right direction. 

  • Hi Craig,

    I used the TI Driver's empty example (along with the default release kernel project). I changed the error setting like you did and added "myErrorFxn" into the source code. I also added a Memory_alloc(NULL, 60000, 0, NULL). I knew this would raise an error. More specifically I knew this would be called

    Error_raise(eb, HeapMem_E_memory, (IArg)obj, (IArg)reqSize);

    I put a breakpoint into myErrorFxn. Here's what the eb looks like in the CCS variables window

    Let's look this some...

    The two args are the handle and the requested size (per looking at the Error_raise call in HeapMem.c). The 60000 for arg[1] confirms this...good.

    The error id is 0x00220000. Take the top 16 bits (0x22 or 34). If you look in the big generated kernel .c file (e.g. in the kernel project debug/configPkg/package/cfg/release_pem3.c) and search for 34, you'll see 

    __FAR__ const CT__ti_sysbios_heaps_HeapMem_E_memory ti_sysbios_heaps_HeapMem_E_memory__C = (((xdc_runtime_Error_Id)34) << 16 | 0);

    So you know the error was HeapMem_E_memory. Note: this id will probably will change across kernel rebuilds.

    The msg is NULL. This is done to save footprint. If you set Text.isLoaded = true; you'll get the message (at the expense of a larger .const section).

    The mod is 47 (this also can change across builds). If you look in the generated rta.xml file (e.g. in the kernel project debug/configPkg/package/cfg/release_pem3.rta.xml), you see this when you search for 47

    <modMap key="ti.sysbios.heaps.HeapMem">
    <id>47</id>

    The file is NULL. Again to save space. If you 1) don't use the ROM kernel and 2) add BIOS.customCCOpts += " -Dxdc_FILE=__FILE__ ";, you'll get the filename. This will be a very large footprint hit on the CC1350 though.

    The line is the line number in the file. 

    There are Error APIs to get all of these values. I detailed all of this to show you that you may not want to enable everything to get the filename. By looking at the mod and id and line number, you can find the reason very quickly albeit offline by cross-referencing the mod and id with the noted files instead of having the target print it out explicitly. 

    Hopefully this answers your questions (and I did not turn the fire-hose on too much).

    Todd

  • Very informative and detailed post, thank you!

    I've managed to replicate exactly what you did with the memory fault and the error block that was generated. 

    My understanding now is that the two args are never going to have a set definition, and are relevant to the type of error generated by Error_raise() and whatever values that wishes to pass. It helps to know that, although it does make it a little trickier to add context to those parameters on fly.

    I've attempted to use BIOS.customCCOpts += " -Dxdc_FILE=__FILE__ "; in my release.cfg to test having the file names generated. I'm checking the original Error_Block and also doing a Error_getSite(eb) but still only getting the line number and 'mod' back. I'm not certain f I would need to use this, but I would like to be able to check the footprint hit.

    I suppose my main concern is getting out an error ID and mod value, but it doesn't actually help me pin down the source of the error. This, for example, would only vaguely hint at the problem being heap memory related, but I still wouldn't have a great idea where in the application it originated.

    In the past, prior to using a custom error handler, I ended up in a hwi exception handler infinite loop. I had always assumed this was as a result of a hwi exception or hard fault, but perhaps that's just where it went for every fault?

    Either way, I would love to be able to easily pinpoint the source of the problem easily, but other than potentially a vague message, I don't have any list I could look up to narrow an error down if these id's were reported (I'm sure a HWI Exception could have many triggers, for example). It's the kind of thing that could potentially happen after a long period too, so it's difficult to resolve with trial-and-error changes to the application.

    I guess what I'm asking is,

    1. what would be the process for pinpointing a random, unexpected error from only an error code and mod value and the two Args?
    2. Is this even possible without also having line number and file name?

    My end goal here is just to be able to extract error information that allows me to identify problem application code with a good degree of certainty, but I'm still feeling like there could be a fair bit of guessing involved.

    Again, many thanks for your original reply, it provided a lot of helpful information despite what my follow-up questions might make you think!

  • Hi Craig,

    This is what I would do with my Error handler:


    #include <xdc/runtime/Memory.h> #include <xdc/runtime/Error.h> #include <xdc/runtime/Types.h> #include <xdc/runtime/System.h> #include <ti/sysbios/heaps/HeapMem.h> Void myErrorFxn(Error_Block *eb) { Types_Site *site; Error_Id code = Error_getId(eb); site = Error_getSite(eb); System_printf("Error id = %d, Module = %d, line # = %d\n", code >> 16, site->mod, site->line ); if (HeapMem_E_memory == code) { // do something special... } }

    This is relatively small impact on the the footprint. I could do something special if I was looking for a specific error (e.g. HeapeMem_E_memory). Note: I used System_printf, but pick you favorite API to either printout the values or store them somewhere to look at later.

    The result of this is following (in ROV for my example)

    The error code tells me it is HeapeMem_E_memory. Note: I forgot to mention that the error id will be unique among error codes. 

    __FAR__ const CT__ti_sysbios_heaps_HeapMem_E_memory ti_sysbios_heaps_HeapMem_E_memory__C = (((xdc_runtime_Error_Id)33) << 16 | 0);

    There was a 33 in my release_pem3.rta.xml file for a logging id (denoted by the 512 on the bottom 16 bits).

    __FAR__ const CT__ti_sysbios_family_arm_m3_Hwi_LD_end ti_sysbios_family_arm_m3_Hwi_LD_end__C = (((xdc_runtime_Log_Event)33) << 16 | 512);

    The Module id says it was in the HeapMem module, so I look in <SL SDK>\kernel\tirtos\packages\ti\sysbios\heaps directory and see only one HeapMem.c file (we usually have 1 source file per module). When I open HeapMem.c and go to line 221, I see this in HeapMem_alloc: 

    210: if (buffer == NULL) {
    211:    Error_raise(eb, HeapMem_E_memory, (IArg)obj, (IArg)reqSize);
    212: }

    So I think you can find the error pretty quickly and accurately. As I type this, I should have printed arg1 and arg2. For the alloc error, it would have been useful to know the requested size. 

    Of course you can get the filename and full message to print out, but as I noted, this will have more impact on the footprint and I do not think it really tells you more information. It's just simplifies things a bit (i.e. you don't have to go look at the files that were generated with that specific build).

    Note: one area that is a little confusing is the Hwi module. We have the ti/sysbios/hal/Hwi which is a top level generic interface. We also have device specific Hwi modules in ti/sysbios/family/... These are separate modules (e.g. the hal/Hwi has module id X and family/arm/ms/Hwi has a different module id). 

    Todd

  • That sounds like a good low-footprint solution. It should be easy enough to make the information more relevant now I understand how, thank you. 

    One thing I'm noticing now is that when myErrorFxn() is called it will immediately leap out of this and into the two functions below it, one after another.
    For now I have commented out what was inside so they run through regardless and allow myErrorFxn to post a semaphore to unblock the task and process the error. I have also commented out the semaphore_post() in myErrorFxn to follow the series of errors without the task interfering...

    void myErrorFxn(Error_Block *eb)
    {
        // HWI exceptions are set to re-route here in release.cfg
    
        // Save the relevant error information
        Types_Site *site;
        Error_Data *args;
    
        site = Error_getSite(eb);
        args = Error_getData(eb);
    
        lastError.timestamp = Seconds_get();
        lastError.code = Error_getId(eb)>>16;
        lastError.line = site->line;
        lastError.mod = site->mod;
        lastError.arg0 = args->arg[0];
        lastError.arg1 = args->arg[1];
    
        // Post the semaphore to being processing the error
        //Semaphore_post(errorHandlerSemHandle);
    
    
    }
    
    void mySysCallbackAbortFxn(CString str)
    {
        //while(1);
        //SysCtrlSystemReset();
    }
    
    void mySystemAbortFxn(uint32_t val)
    {
        //while(1);
        //SysCtrlSystemReset();
    }

    Before it jumps into these two functions, in myErrorFxn() I'm getting what you had in your first example, much as I'd expect:
    Error: 34, Mod: 47, Line: 307
    ( HeapMem_E_memory, <modMap key="ti.sysbios.heaps.HeapMem"> )

    On leaving myErrorFxn() it enters mySysCallbackAbortFxn(), and the CString is showing "xdc.runtime.Error.raise:.terminating.execution". It then jumps into mySystemAbortFxn().

    Following this we're straight back into myErrorFxn, but this time reporting a different error:
    Error: 3, Mod: 9, Line 52
    ( xdc_runtime_Error_E_memory__C,  <modMap key="xdc.runtime.Memory"> )

    As it runs through the other two functions again the same as before is reported.

    I've tried to use the method you described above in an attempt to pin down and debug this error, and I found the xcd/runtime/memory.c file. It seems that line is from the Memory_alloc() function:

    if (block == NULL && (prior || !Error_check(eb))) {
            Error_raise(eb, Error_E_memory, (IArg)heap, (IArg)size);
        }

    Is there some sort of overlap with Error_raise() and the sysCallback/SystemAbort error handlers that I haven't considered? It creates a difficult situation where I can't even store the first before the second error interrupts the task again.

  • Hi Craig,

    An error causes the application terminate under the following conditions
    1. In the .cfg, the following is set: Error.policy = Error.TERMINATE;
    or
    2. If NULL is passed in for the Error_Block. Looking back, we wished we had not done this. If an error occurs with a valid (and initialized Error_Block) or if you use Error_IGNORE, the abort is not called. So the following will cause the abort to happen (regardless of the Error.policy setting)
    Memory_alloc(NULL, 0x20008, 0, NULL);
    whereas the following does not (if the Error.policy is Error.UNWIND
    Memory_alloc(NULL, 0x20008, 0, Error_IGNORE); // or use an initialized Error_Block

    Todd
  • Thank you Todd,

    I'm still not sure why I'm getting two consecutive errors being reported for the one function call. It doesn't really matter as long as they're the same since I'm going to be doing a soft reset after the first one anyway!
    For now I'm fairly satisfied that I've got a decently functional error recorder, and I'm sure I can expand it later to add more detail and catch extra problems if I feel the need.

    Cheers,
    Craig