This thread has been locked.

If you have a related question, please click the "Ask a related question" button in the top right corner. The newly created question will be automatically linked to this question.

CC3220SF: XDS110 debug probe problem.

Part Number: CC3220SF
Other Parts Discussed in Thread: UNIFLASH, SYSCONFIG

Hello support team.
I'm having a problem debugging with XDS110 and CC3220SF.
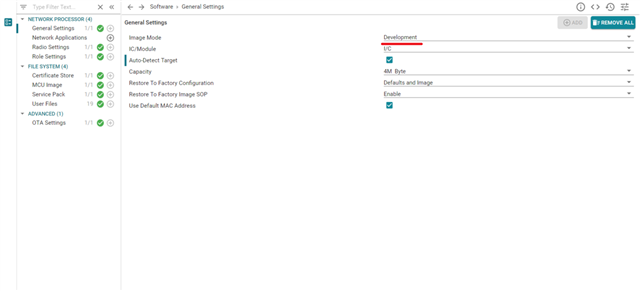
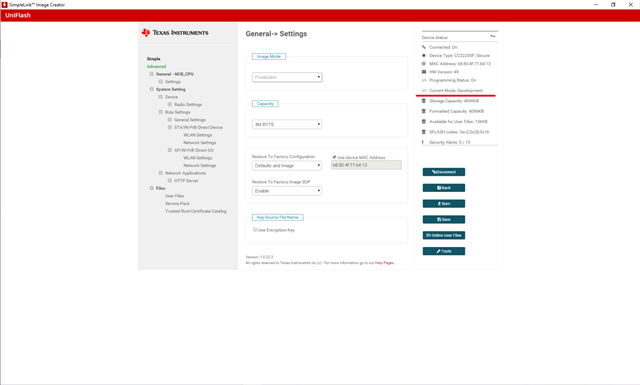
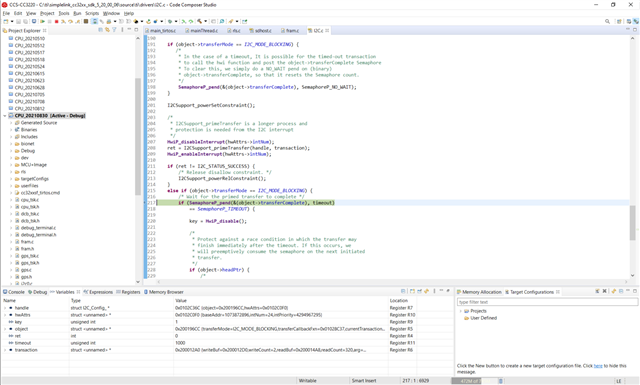
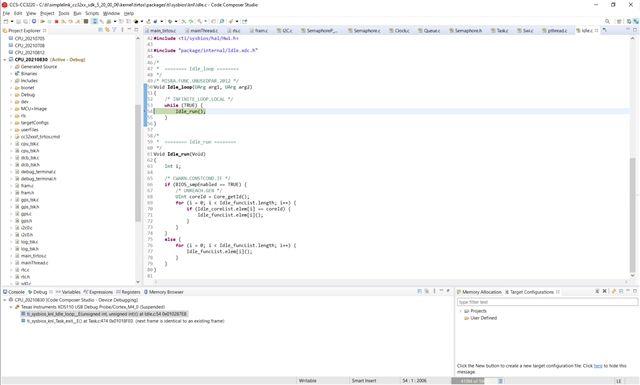
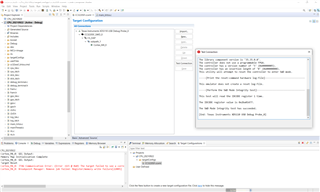
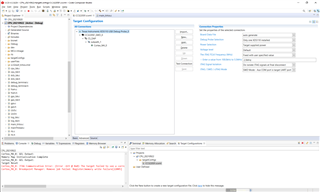
My application runs in "MCU + Image" configuration, but in "Debug" mode it's giving the message below:

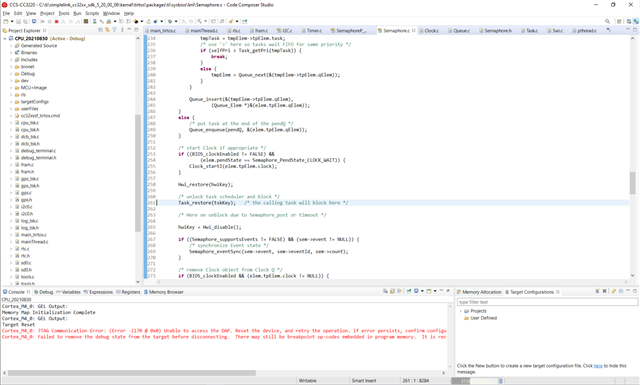
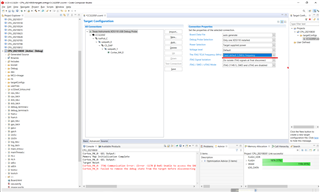
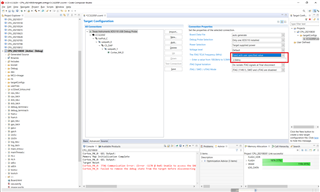
Cortex_M4_0: JTAG Communication Error: (Error -1170 @ 0x0) Unable to access the DAP. Reset the device, and retry the operation. If error persists, confirm configuration, power-cycle the board, and/or try more reliable JTAG settings (e.g. lower TCLK). (Emulation package 9.3.0.00058)
Cortex_M4_0: Failed to remove the debug state from the target before disconnecting. There may still be breakpoint op-codes embedded in program memory. It is recommended that you reset the emulator before you connect and reload your program before you continue debugging

I've restarted the target, the debugger and my computer several times, but the same problem always occurs.

The Code Composer Studio version I'm using is 10.3.1.00003;
The SimpleLink CC32xx SDK version is 5.10.0.02.

Thank you.

  • Hi Carlos,

    When the device is in production mode, JTAG is deactivated.

    Try putting the device in development mode to enable the JTAG. See the CC3220 UniFlash User's Guide here.

    BR,

    Seong

  • Thank you so much Seong.

    My project is already in development mode, as shown below.

    I can load the program and run it to the point where that error message pops up.

    Thank you for the response.
  • Hi Carlos,

    It seems you not have programmed sFlash. Please read this.

    btw... do you use own hardware or LaunchPad?

    Jan

  • Hi Jan, thank you very much for the reply.

    I accessed the device through Uniflash to confirm the current mode. It is indicating that it is in development mode.
    What am I doing wrong?

  • Hi,

    What hardware do you use? It is own hardware with CC3220SF (CC3220MODSF) or LaunchPad? In case of LaunchPad is used please make sure that JTAG jumpers (TDI, TDO, TCK, TMS, etc.) are properly connected and proper SOP mode is used (SWD vs 4-pin JTAG).

    In case of you are using own hardware, please provide more details about your configuration.

    Jan

  • Hello Jan.

    The hardware I am using is a custom board equipped with the CC3220MODASF12MONR module.
    I've been developing on this target for over eight months, so I believe it's not a configuration error.
    The application starts in debug mode and runs normally, I can run it step by step, put break points, but when it reaches a certain part of the program, that error message appears.
    I tried replacing it with another board and curiously, the program doesn't even load and a window appears with the same error.
    I'm starting to suspect that the probe might be damaged. Unfortunately I don't have another one to test.
    I have the LAUNCHCC3220MODASF, I noticed that the board has the J4 connector "XDS110 OUT", I think I can use it to do the test, but first I need to get a cable to connect with my board.

    Could you tell me if there is any test I can do with my probe to check if it is broken?

    Thank you.

  • Hi,

    It it unlikely that your debug probe is broken. When JTAG connection is lost due to debug it is likely issue with power source or connection is lost due to entering power save mode. Did you check supply voltage by oscilloscope for a voltage drops? What was a place where was JTAG connection lost (it was somewhere around sl_Start() API)?

    I am not sure why your 2nd board is not working. Maybe you can inspect soldering of your module by x-ray.

    For JTAG output from LAUNCHCC3220MODASF you don't need to use XDS110 OUT connector. You can disconnect jumpers TDI, TDO, TCK, TMS and use standard jumper wires. But do not forgot to connect GND as well.

    Jan

  • Thanks for the replies Jan.
    I monitored the supply voltage until the error message appears and I didn't notice any anomalies.
    I arranged the cable to plug into the XDS110 OUT connector, as I use the same connector on my target. Using the LAUNCHCC3220MODASF the same thing happens. It really wasn't the probe that was broken.
    In my tests, the error message happens inside a loop, where I do reads and writes to an I2C FRAM memory, see figure 1. In this figure, you can see that the loop control variable "dbg_rls_idx", you can see that the loop has already run 10 times. Sometimes the problem manifests itself in turn number 9.
    I tried commenting the loop and noticed that the message happens later. I don't believe it's an error in the application code, as the message comes up at different points, as if some JTAG resource ran out. When I run the same code without the JTAG, writing the image in CC3220, everything seems to work fine. I need JTAG as I want to debug new functionality.
    I don't know if it might have something to do with it, but I inserted a "cfg" file in the project, because I wanted to use the "Execution Analysis" feature, this inclusion made about five months ago, I managed to use the tool and so far there had been no problem. I saw that there is a setting that defines the size of the logging area, maybe it can have some influence, I'm sending the cfg file as an attachment. I inserted the cfg file and made the changes without much knowledge of what I was doing. It could be that I did something wrong. Could you please examine the cfg file?

    Thanks a lot for the help.

     5700.release.cfg

  • Hi,

    It is hard to say what is going on at your case without debugging of real code.

    It seems you have disabled hard fault hander at your c.cfg file. Maybe you can try to enabled default hander and see what is going on. Maybe you have exception and you did not noticed that because your have disabled hander.

    m3Hwi.enableException = true;

    Improperly configured RTOS diagnostic tools may to affect function of code. Another reason can be behaviour due to non-initialised variables or different timing during JTAG/SWD debug and execution code loaded from sFlash. Who knows. In case of such issue, is hard to give exact answer. Maybe you can use your backup where your code was functional and compare changes with your current code.

    Jan

  • Hello Jan.

    Sorry for the delay.
    I was busy with other activities and I was only able to resume now.
    I ran the code step by step to try to figure out the exact code point that the JTAG crash.

    Figure 1 shows the call to the I2C_transferTimeout function;
    The I2C_transferTimeout function executes correctly until reaching the line indicated in figure 2;
    Within the SemaphoreP_pend function figure 3, the Semaphore_pend function is called, where I managed to reach the line indicated in figure 4;

    When I run the Task_restore function by pressing F6 (step over) the debug crash as shown in Figure 5;
    Running Task_restore with F5 (step into), I can get to the Idle_loop function, seen in Figure 6;

    In the Idle_loop function the step-by-step execution seems to get stuck in the wait loop, I tried putting a break point in the line below the I2C_transferTimeout function and pressed Resume, surprisingly it ran and stopped correctly, as shown in figure 7.

    Figure 1.

    Figure 2.

    Figure 3.

    Figure 4.

    Figure 5.

    Figure 6.

    Figure 7.

    I don't know if this test helps anything, but if you can give me any more tips to solve my problem, I'm grateful.

  • Hi Carlos,

    Have you tried using the latest SDK

    What TCLK speed are you using? Have you tried reducing it to 2.5MHz from the default, 8MHz?

    BR,

    Seong

  • Hello Jan.

    The tests I mentioned in the previous post were done on the latest versions of the development tools.

    I'm using CCS version 10.4.0.00006, SDK 5.20.0.06 and Sysconfig 1.9.0.

    I initially ran the tests with default TCLK which seems to be 5.5 MHz, see figure 1.

    I lowered the TCLK speed to 2.5 MHz, as shown in figure 2, but it didn't work.

    figure 1.

    figure 2.

  • Sorry Seong, I confused you with Jan.

    I'll take the opportunity and pass on the message of the JTAG connection test:

    [Start: Texas Instruments XDS110 USB Debug Probe]

    Execute the command:

    %ccs_base%/common/uscif/dbgjtag -f %boarddatafile% -rv -o -S integrity

    [Result]


    -----[Print the board config pathname(s)]------------------------------------

    C:\Users\carlo\AppData\Local\TEXASI~1\CCS\
    ccs1040\0\0\BrdDat\testBoard.dat

    -----[Print the reset-command software log-file]-----------------------------

    This utility has selected a 100- or 510-class product.
    This utility will load the adapter 'jioxds110.dll'.
    The library build date was 'Jun 25 2021'.
    The library build time was '11:45:30'.
    The library package version is '9.4.0.00129'.
    The library component version is '35.35.0.0'.
    The controller does not use a programmable FPGA.
    The controller has a version number of '5' (0x00000005).
    The controller has an insertion length of '0' (0x00000000).
    This utility will attempt to reset the controller.
    This utility has successfully reset the controller.

    -----[Print the reset-command hardware log-file]-----------------------------

    The scan-path will be reset by toggling the JTAG TRST signal.
    The controller is the XDS110 with USB interface.
    The link from controller to target is direct (without cable).
    The software is configured for XDS110 features.
    The controller cannot monitor the value on the EMU[0] pin.
    The controller cannot monitor the value on the EMU[1] pin.
    The controller cannot control the timing on output pins.
    The controller cannot control the timing on input pins.
    The scan-path link-delay has been set to exactly '0' (0x0000).

    -----[Perform the Integrity scan-test on the JTAG IR]------------------------

    This test will use blocks of 64 32-bit words.
    This test will be applied just once.

    Do a test using 0xFFFFFFFF.
    Scan tests: 1, skipped: 0, failed: 0
    Do a test using 0x00000000.
    Scan tests: 2, skipped: 0, failed: 0
    Do a test using 0xFE03E0E2.
    Scan tests: 3, skipped: 0, failed: 0
    Do a test using 0x01FC1F1D.
    Scan tests: 4, skipped: 0, failed: 0
    Do a test using 0x5533CCAA.
    Scan tests: 5, skipped: 0, failed: 0
    Do a test using 0xAACC3355.
    Scan tests: 6, skipped: 0, failed: 0
    All of the values were scanned correctly.

    The JTAG IR Integrity scan-test has succeeded.

    -----[Perform the Integrity scan-test on the JTAG DR]------------------------

    This test will use blocks of 64 32-bit words.
    This test will be applied just once.

    Do a test using 0xFFFFFFFF.
    Scan tests: 1, skipped: 0, failed: 0
    Do a test using 0x00000000.
    Scan tests: 2, skipped: 0, failed: 0
    Do a test using 0xFE03E0E2.
    Scan tests: 3, skipped: 0, failed: 0
    Do a test using 0x01FC1F1D.
    Scan tests: 4, skipped: 0, failed: 0
    Do a test using 0x5533CCAA.
    Scan tests: 5, skipped: 0, failed: 0
    Do a test using 0xAACC3355.
    Scan tests: 6, skipped: 0, failed: 0
    All of the values were scanned correctly.

    The JTAG DR Integrity scan-test has succeeded.

    [End: Texas Instruments XDS110 USB Debug Probe]

  • Hi Carlos,

    From provides information I am not able say what can be reason of issue. But I don't believe that issue is related to physical connection by JTAG. Just for a test. Can you check at SWD mode (2-wire JTAG)?

    If I heard about similar issue, it comes to my mind these variants:

    • issue with JTAG high clock or interferences due to importer wiring (it does not look like that at your case)
    • issue due to insufficient power source (according your previous statement you tested power source already)
    • improper implementation of power save modes
    • pinmux issue during runtime (that means switching pins for JTAG to alternate function during runtime)
    • JTAG connection lost due to WDT reset

    Jan

  • Hello Jan.

    The SWD interface (2-wire JTAG) was not provided on my custom board, I don't have access to pins 21 and 22 of the CC3220MODASF12MONR module. Therefore I cannot take the test you requested.
    I did several tests downgrading the IDE CCS version along with the SDK and even downgraded the firmware of the XDS110 and LauchPad from version 3.0.0.16 to version 3.0.0.15 and the problem continued.
    I noticed that the error messages alternate, sometimes the error -1170 appears, other times it appears -241 and also -242.
    This project, I originally created it from the Out Of Box example that was available in January 2021.
    I tried to recreate the project again, using the latest version of Out Of Box, but it didn't solve the problem either.
    At all times, the problem is related to the successive call of the I2C_transferTimeout function, as I mentioned in a previous post.
    It seems that there is some kind of overflow with the probe, is there any JTAG LOG that can be examined to try to see what is causing this problem?
    I tried running the Out Of Box example in Debug mode on my LauchPad, when I pressed the SW2 switch, the error message in the figure below appeared. I don't know if the Out Of Box example can be run in Debug mode, but I decided to comment, because the error -242 and -1170 came up and I thought it might be related.

    Thank you very much.

  • Hi,

    What exact pins do you use for JTAG? How you can use 4-pin JTAG (TDI, TDO, TCK, TMS) without connected pins 21 and 22?

    Jan

  • You're right Jan.

    I spoke nonsense.
    The pins for SWD are the same as the 4-pin JTAG.
    I did the tests changing the debug interface to SWD.
    As shown in Figure 1, error -615 occurred:

    Cortex_M4_0: JTAG Communication Error: (Error -615 @ 0x0) The target failed to see a correctly formatted SWD header. The connection to the target may be unreliable. Try lowering the TCLK setting before trying again. (Emulation package 9.4.0.00129)
    Cortex_M4_0: Breakpoint Manager: Remove job failed: Register/memory write failure[22005]

    I tried reducing TCLK to 2.5 MHz, but the same problem occurred as shown in figure 2.
    I also tested it with 1.0 MHz TCLK, but it didn't work either, as shown in figure 3.

    I ran the program step-by-step and verified that the execution progressed a little, the problem arose a little further in relation to the 4-wire JTAG test, but the problem is still with the call to the I2C_transferTimeout function, as shown in Figure 4.

    Regarding the other comments I made in the previous post, could you tell me something?

    Thank you very much.

    Figure 1.

    Figure 2.

    Figure 3.

    Figure 4.

  • Hi,

    Have you set proper SOP mode for SWD debug?

    Was you able execute OOB example at your hardware as is at SDK? But when you add your code into this example is comes into trouble with JTAG right?

    Unfortunately screenshots above does not provide us any new information. Do you use power save modes (using power management framework) inside your code somehow? Can you temporarily disable this code?

    Jan

  • Hello Jan.

    Yes, I changed the SOP pins setting to:
    SOP0 = High;
    SOP1 = Low;
    SOP2 = Low.
    According to the connection test in figure 1 of my previous post, SWD mode looks correct.
    My hardware and Launchpad are quite different, I can even load OOB on my hardware, but it doesn't run properly due to hardware differences.
    I noticed that running the OOB example on the LaunchPad in Debug mode, when pressing SW2, an error occurs. In the case of SWD mode, error -615 appears and in 4-pin JTAG mode, error -242 and -1170 appears.
    I noticed that on my hardware, the SW2 equivalent pin ends up being active and so it has the same errors as the LaunchPad.
    Can the OOB example run in Debug mode?
    Could you test the OOB example in Debug mode and tell me if pressing SW2 also gives an error?
    Regarding the question about energy saving, I didn't add anything regarding that. I believe that is not the problem.

    And regarding the I2C_transferTimeout function, is it just a coincidence?

    Thank you very much.

  • Hi,

    At my computer I have installed old CCS version (8.3.1) and from this reason I cannot run OOB example right now because this example uses Sysconfig. I have quickly check source code of OOB example from 5.20 SDK. When is SW2 pressed at OOB example, device is switched into AP mode and rebooted. In this state can be loosing of JTAG connection expected. Before JTAG connection lost at OOB you can expect at log ... "[Control task] device started in AP role, rebooting device...".

    If you want, you can deactivate function of SW2 by commeting message queue inside handler pushButtonInterruptHandler2().

    I am not able to say what is connection between I2C and JTAG disconnection at your case. If this is just coincidence or there is some hardware or software connection.

    Jan

  • Hello Jan.

    I'm not sure I understand correctly, in the OOB example running in Debug mode, when pressing SW2, the error messages -615 in SWD mode and -242 and -1170 in 4-pin JTAG mode shouldn't appear?

  • Hi Carlos,

    The JTAG disconnection is expected upon reset, entering LPDS, or hibernate. The control task in the OOB demo resets the device.

    Which pins are you using for the I2C again? I don't see that in your earlier posts.

    Best regards,

    Sarah

  • Hi Sarah

    Many thanks for the reply.
    In this case, I understand that it makes no sense to discuss error messages in this situation. However, I'm looking for differences in how my LP and probe works that can help me determine what causes debugging to break, as these error codes are very similar, I figured they might be related.
    JTAG was working satisfactorily until last month, the problem arose without any significant changes to the code and the hardware remained the same.
    I suspect it might be some of the latest development tools updates.
    I tried to downgrade to the previous versions that were working, but with no success, maybe something is still missing.
    The problem is specifically with the debug tool, even using the latest versions of the IDE (10.4.0), SDK (5.20.0), the image generated in MCU+Image runs correctly.
    I don't have many leads to follow, so sorry for the insistence.

    Thank you very much.

  • Hi Carlos,

    Those error codes do not seem like software tool problems. Either something in your application is interrupting the JTAG (like entering a low power mode, toggling a pin also used by the JTAG), or your JTAG hardware may be failing. Have you tried another JTAG debugger? You can jumper wire to the one on the LaunchPad.

    Best regards,

    Sarah