This thread has been locked.

If you have a related question, please click the "Ask a related question" button in the top right corner. The newly created question will be automatically linked to this question.

IAR 8.20 with CC2540 - Failed to clear breakpoint: Driver error

Does anyone have any idea why IAR is unable to deal with break-points...


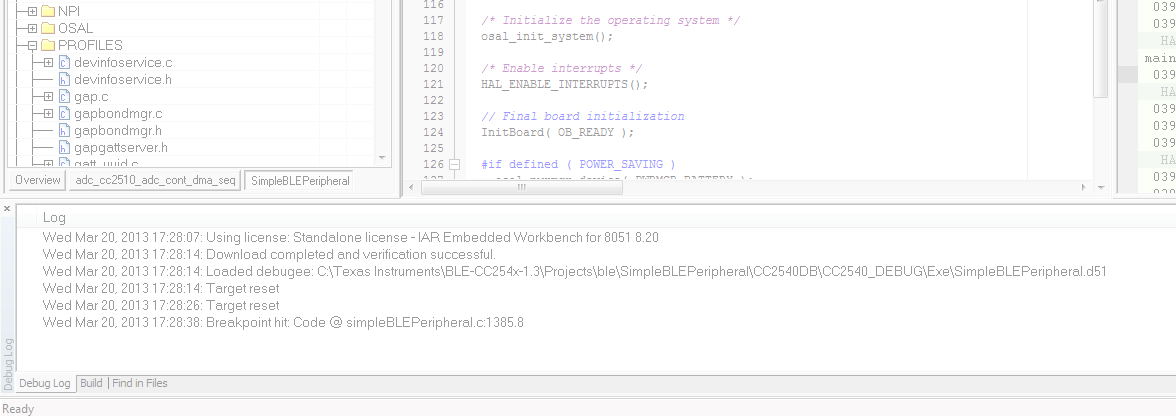
I am trying to debug my code, but IAR will not allow breakpoints to be set.

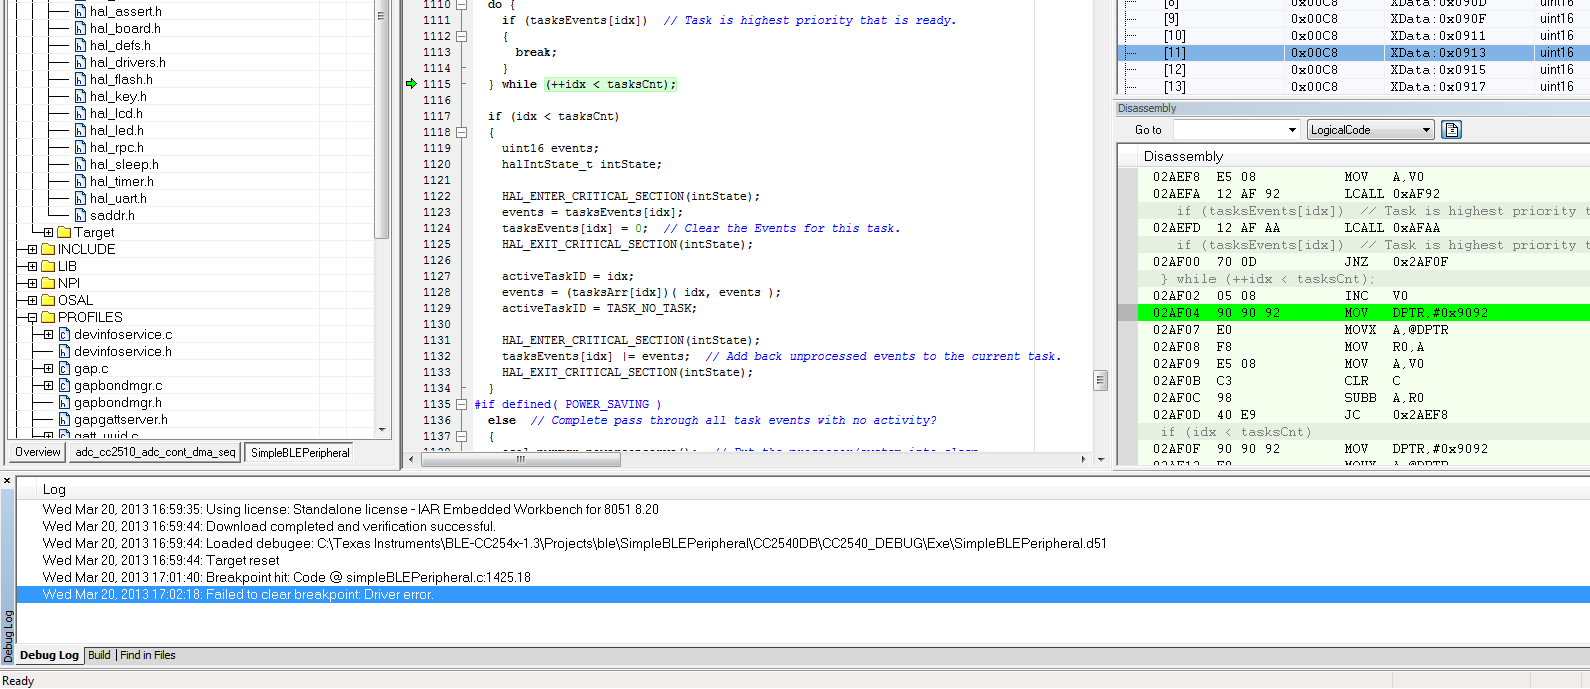
The Debug-Log window states "Failed to clear breakpoint: Driver error" as shown in the following image (CLICK TO ENLARGE):-

Thank you in advance.

  • Ps.

    I am also, sometimes, getting the following screen, where IAR acknowledges the breakpoint but between IAR and Windows, I get the greyed out screen (as shown below - CLICK IMAGE TO ENLARGE) and infinite looping blue circle.

    I get the message "Breakpoint hit: Code @ simpleBLEPeripheral.c:1385.8"

    It all locks up the same as above....

  • Hello Joe,

    You cannot set or clear break points when IAR is running.  The debugger has to be stopped to do this.  There is also a limit to the number of break points that can be set.

    To see all the breakpoints you can go to the menu bar and see them under View.

    Thanks,

    --Mark as VERIFIED if this answers your question.

  • Hi Mark,

    Thanks for your comments.

    You're right, you can not set break-points on the fly...


    My problem is that I set break-points before clicking the 'Go' or "->>>" button.

    IAR acknowledges the BP, with a red dot but, IAR locks up when I hit the breakpoint and will not recover until I shut it down and start over, losing all my settings and more importantly not allowing me to debug my code.


    Any ideas??

    Regards,

  • Sounds like it could be a problem with the install.  Have you tried reinstalling the software?  Have you contacted IAR on this issue?

    Does this happen when you run in simulation mode?

    Thanks,

  • Check if the settings in Linker Output of your project is like the following image.

  • Thanks Greenja,

    That's what I originally thought of doing, to reinstall but IAR didn't think that was  going to help because IAR replied to this suggestion with;

    It rarely helps to uninstall/reinstall.

    But if you want to try then it is just a windows application so use the Control Panel Add/Remove programs to remove it and install again in a new folder. "

    I'm worried about installation because my original upgrade from 30day-trial-to-dongled-version was painful. Licensing Manager simply would not let me run IAR even though I had a fully licensed copy and dongle plugged into my PC. Despite this history, IAR is adamant that there's something else and they can't put their finger on it.

    Even though IAR EW IDE doesn't function as a 'Debugger'....I have been reluctant to un/re-reinstall because I currently have a working 'Compiler' and don't want to lose that too.

    I'm able to generate HEX files of my code, flash it into my target do testing that way, but I really wish I could make use of the Debugger, C-Spy or what ever IAR calls it, the ability to set break-points and step through my code and see values of my variables and registers.

    Although, I think you may be right, it may be time to start backing up my code and start over.

    Thank you.

  • Thanks Yikai Chen,

    This is the kind of thing I suspect is wrong, but my settings are the same as those shown in your image I'm afraid, so this is not it.

    Thank you for your time and effort.

    Regards,

  • One thing you can try is going to the Texas Instruments Emulator on the menu bar and selecting Leave Target Running.

    Thanks,

  • I have a 30-day license too, and am seeing that I can set and clear breakpoints in the OSAL_projectName.c and projectName_Main.c files, but not in my application file.  I can select lines there, but can't toggle breakpoints.  Are you seeing the breakpoint abilities only in some files?

  • You can try to change the optimization level to middle or low to see if it works.

  • In my case it was functions not getting compiled in.  While they were included in the build, nothing in OSAL_projectName.c was referencing projectName_Init().  I'm now setting breakpoints in my projectName.c file.