This thread has been locked.

If you have a related question, please click the "Ask a related question" button in the top right corner. The newly created question will be automatically linked to this question.

Unknown source of excessive power consumption during coordinator - end device association

Other Parts Discussed in Thread: CC2531, Z-STACK

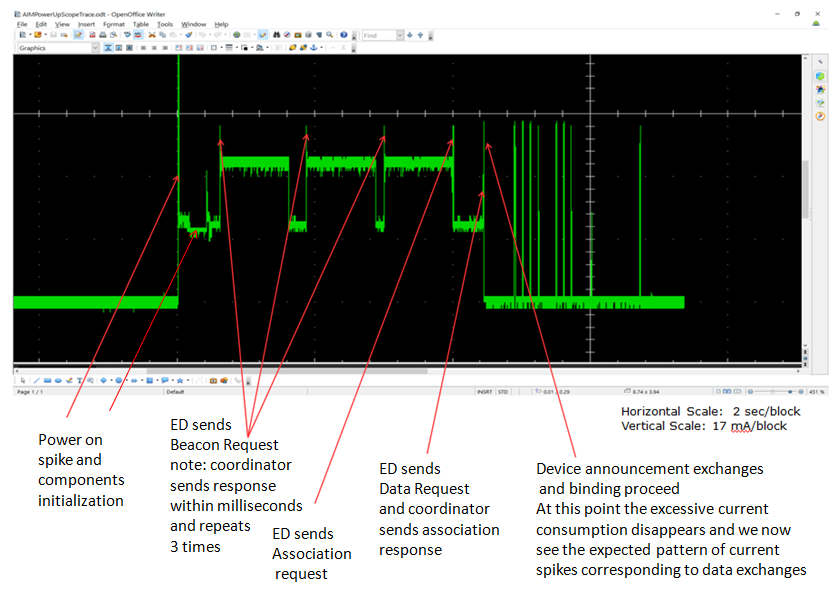
See below the power up profile of our ZigBee sensor.

We would appreciate help in how to identify the tasks that are consuming power during the initial stage. At this stage only activities in the MAC layer are supposed to happen? We can reduce the number of beacon requests, but the fundamental issues are:

- why does the current consumption stay up so high following a beacon request, when in fact nothing is happening? We would in fact expect to see the baseline to drop to zero when the 1st beacon request is sent ?

- the End Device finally sends an Association Request, to which the coordinator reponds following the ED sending a Data Request. Is this normal behaviour (meaning is the coordinator always waiting for ED Data Requests to proceed to the next step in association/ binding?

  • That looks like RX is turned on to receive Beacon frames from neighbor ZCs and ZRs. You cannot avoid it. You can use Ubiqua Packet Analyzer to check if there are lots of ZCs and ZRs around the test environment.
  • You can also try to decrease define NUM_DISC_ATTEMPTS from 2 to less and you should see less 3 large power consumption.
  • YK - Thanks for the 2 answers above
    Your 2nd reply....
    Yes yesterday we reduced NUM_DISC_ATTEMPTS with the desired effect of having only one Beacon exchange instead of 3....

    Your 1st reply.....
    We have been careful about our test environment, and there positively are no other ZCs and ZRs. We have been using Ubiqua with CC2531 dongles all along (you may or may not recall we had a thread concluding we had 'bad dongles'...)

    So you say the logic in the MAC layer, upon sending a 'Beacon Request', is to keep listening for 'Beacon' replies from any ZC or ZR (note we do not have ZR's at all).
    Our trace shows that we receive the response 1.8 msec later. So having received the response, can we then after, say, 5 millisecs or even immediately, decide there are no other responses to be had and then proceed to the next step - which is to send the 'Association Request"?
    Where do we find this logic in the Z-Stack MAC Layer? How do we identify the timers/ tasks that are idling?
    Thanks
  • As I know, Z-Stack doesn't open those parameters for application developers.
  • Can you put us in touch with developers who develop battery-powered ZigBee sensors - sensors which have to exist for years, not hours, in the field and who cannot tolerate this mode of operation. We're using Home Automation profile - perhaps you can advise us on which profile doesn't have these issues?
  • Our company has developed lots of battery powered Zigbee HA profile devices and I don't see why this is an issue.
  • 20mA uselessly consumed during a time-out of over 1 second not a problem?
  • Doesn't it only happen when Device tries to search Zigbee network to join?
  • Correct.
    Our application is a sensor on a pallet which travels from factory to depot to Distribution Center to Stores, tracking temperature and shock of perishable goods, and associating with a ZigBee network where installed (but not everywhere). There will therefore be long transit periods when the sensor is isolated, and will fail to find a parent.
    Some of the time we will be able to put the 2538 in PM3 and wake up on interrupt, but sometimes we will have to be running on a timer, wake up, look around, fail to find a network, and then go back to sleep. This is fundamental to our application and when we get orphaned and fail to find the new parent we need to fail FAST
  • You can try to manipulate init code in ZDApp.c to stop sending beacon requests after a few times of tries.