This thread has been locked.

If you have a related question, please click the "Ask a related question" button in the top right corner. The newly created question will be automatically linked to this question.

CC2530: ZNP stuck inside osalTimerUpdate - ZStack 3.0.2

Part Number: CC2530


The serial interface of the ZNP was not responding, and as IAR was open in a debug sessin, I have more information.


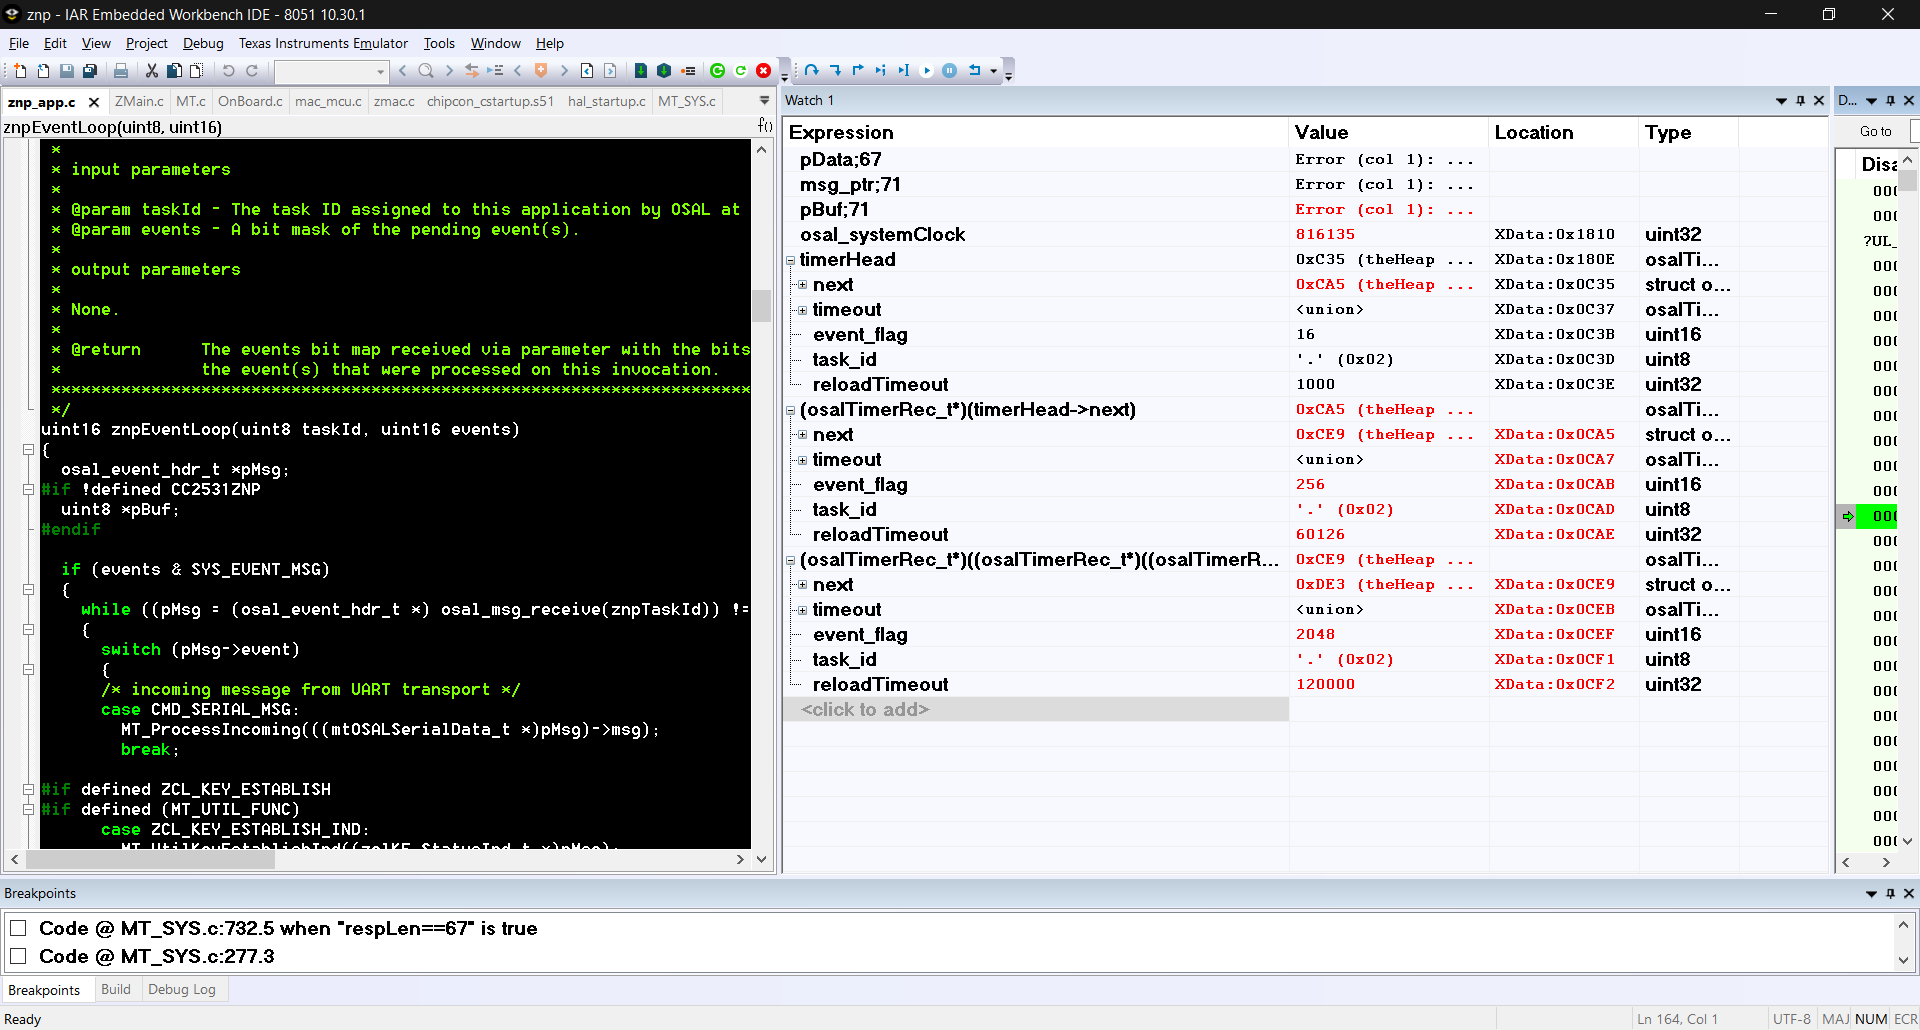
My interpretation of the timerHead LinkedList is that it is corrupted. A clean linked list has only one bit in the event_flags .
The screenshot should help understand that. I also saved memory from using Debug > Memory > Save . I do not know what is required exactly to be able to reload it.


I join the logs. The last communications of the ZNP are shown here:

[2020-11-22 17:11:58.996636] > [AF/AREQ] **DATA_CONFIRM** ZSuccess EP:01 Seq:6 (SYS:4/TYPE:40/CMD:80) ( 8)::fe 03 44 80 00 01 06 c0
[2020-11-22 17:11:58.987306] 19618 0x0000 → 0xfec7 ZigBee HA 51 ZCL: Discover Attributes, Seq: 6
[2020-11-22 17:11:58.993800] 19621 → IEEE 802.15.4 5 Ack
**** Not sure that this was a valid communication from the ZNP, but just in case:
[2020-11-22 17:12:04.972770] 19638 → 0xec5c IEEE 802.15.4 52 Reserved, Dst: 0xec5c, Bad FCS

For the future, I am casting the type for "next" so that I do not need to cast it in the debugger.

typedef struct osalTimerRec_s
{
struct osalTimerRec_s *next;
osalTime_t timeout;
uint16 event_flag;
uint8 task_id;
uint32 reloadTimeout;
} osalTimerRec_t;

This is a normal linked list:

I was able to save a bit of RAM as well by changing the storage class of a big variable in MT.c:

Before:
239 887 bytes of CODE memory
32 bytes of DATA memory (+ 70 absolute )
7 935 bytes of XDATA memory
192 bytes of IDATA memory
8 bits of BIT memory
426 bytes of CONST memory

After:

239 887 bytes of CODE memory
32 bytes of DATA memory (+ 70 absolute )
7 891 bytes of XDATA memory
192 bytes of IDATA memory
8 bits of BIT memory
470 bytes of CONST memory

Here is the seriallog and gateway log and sniffer log.  Hopefully that heps to identify what caused this   I can send a download link to the project (with logs, etc) - as it contains the source, I can do it by private mesage.

ZNP_StuckInosalTimerUpdate.zip

  • For your reference, I will reset CC2530 if my host application cannot get MT command response from serial interface contineously.

  • You are right.  In my case that should be done in the gateway.

    Teh problem is also that the watchdog of the CC2530 is maximum 1 second or so.  In case the ZNP is a controller or a router, it could be set though and triggered every second, and "software" watchdogs could be added in the ZNP as well.

    Of course, the bug resulting in this is better solved...

  • Hey Mario,

    Did you happen to capture the call stack during this time?  It is apparent that you are encountering the RAM limitations of the CC2530, which is noted in SWRA635.  CC2530 ZNP resets may be necessary based on MT UART/network traffic taxing the RAM availability.

    Regards,
    Ryan

  • I didn't look in the right place for the call stack. There was not much to make of the call stack.
    I do not know if we could make anything form that.

    There's no more than 6 devices in the network.

    The logs show that there isn't a lot of traffic.

        #define MAXMEMHEAP 3017   /* isn't enough? */

    In General options:

    Normally the compiler should check how much stack it needs, I do not know if it does that.

    osal_mem_alloc checks if there is enough memory .

    So you confirm that I do not have enough memory?!

  • Dear Ryan

    Apparently the pasted images are not visible on the site, it showed that XDATA stack size is 4D0.

    We can compare the screenshots and also read the hex file dump of XDATA memory.

    In the hex dump we can find the Timerhead value, so this is the correct dump:

    This value is invalid as it is inside the STACK which ends at 0x4D0.  Unfortunately it is not initialized, so visual inspection does not allow to know if there was a lack of STACK -> I add initialisation in the code so that we can see this next time.
    For the moment the stack pointer did not go below 0x03f0.

    Local variables are mostly mapped to registers so we can't find them for the function in use.

    I examined the variables located near Timerhead, and extracted their values from the XDATA dum:

    osalMemStat 25  -> can only be 0 or 1, so is corrupted.
    pgOff   01012502012504012506012509
    pgLost  0801250A01250C01250E012510
    pgRes   01
    hotPg   251201
    hotOff 250002180402
    pwrmgr_attribute 1B000330010322 -> These are all 0 in my case.
    TimerHead 0203  -> 0x0302
    OsalSystemClock 26030318
    tasksEvents 040318060318070342080342AB
    

    So it looks like the pwrmgr_attribute was also corrupted, and we are near address 0x1800.

    But the end of the heap is not too far away:

    XDATA_Z
      Relative segment, address: XDATA 00000C19 - 000017E0 (0xbc8 bytes), align: 0
      Segment part 7.             Intra module refs:   osal_mem_alloc
                                                       osal_mem_free
                                                       osal_mem_init
               LOCAL                   ADDRESS         
               =====                   =======         
               theHeap                 00000C19 

    A copy of the last DATA_CONFIRM (or an earlier one) can be found in the heap, that memory would be available for reservation as it should be freed.

    :1006A000000000FE034480000106C0C7FE0E0100EA

    Starting from address 0x17Db in the XDATA dump there seems to be some kind of pattern.  That might give a clue about what caused the data overwrite:

    Starting from 0x17DB
    000025
    010025
    000125 # osalMemStat is the first fixed variable and it is 0x25 on this line
    010125
    020125
    040125
    060125
    080125
    0a0125
    0c0125
    0e0125
    100125
    120125
    000218
    04021b
    000330
    010322
    020326
    030318
    040318
    060318
    070342
    080342
    

    This seems too regular to me.

    It should be possible to have an idea about what this is.

  • I got it, this is from a communication after the failure:

    [2020-11-22 18:51:56.768371] 20822        0xfec7 → 0x0000       ZigBee HA 124 ZCL: Discover Attributes Response, Seq: 5^M
    [2020-11-22 18:51:56.768433] 20823               →              IEEE 802.15.4 5 Ack^M
    [2020-11-22 18:51:56.783757] 20824        0x0000 → 0xfec7       ZigBee 45 APS: Ack, Dst Endpt: 14, Src Endpt: 1^M
    [2020-11-22 18:51:56.784238] 20825               →              IEEE 802.15.4 5 Ack^M
    [2020-11-22 18:51:56.790531] >  ( 48)::fe 63 44 81 00 00 02 07 c7 fe 0e 01 00 17 00 d6 ad 25 00 00 4f 18 05 0d 01 00 00 25 01 00 25 00 01 25 01 01 25 02 01 25 04 01 25 06 01 25 08 01
    [2020-11-22 18:51:56.797722] >  ( 56)::25 0a 01 25 0c 01 25 0e 01 25 10 01 25 12 01 25 00 02 18 04 02 1b 00 03 30 01 03 22 02 03 22 03 03 18 04 03 18 06 03 18 07 03 42 08 03 42 00 04 2a 0e 04 2a c7 fe 1d ac
    

    And this was received near the time the last communication occurred:

    $ grep "Discover Attributes" ZNP_StuckInosalTimerUpdate.log
    [2020-11-22 17:11:58.266573] 19606        0x0000 → 0xfec7       ZigBee HA 51 ZCL: Discover Attributes, Seq: 3
    [2020-11-22 17:11:58.308222] [GATEWAY/HNDL] MISC1  : Processing Discover Attributes Response
    [2020-11-22 17:11:58.599316] 19612        0x0000 → 0xfec7       ZigBee HA 51 ZCL: Discover Attributes, Seq: 5
    [2020-11-22 17:11:58.653239] [GATEWAY/HNDL] MISC1  : Processing Discover Attributes Response
    [2020-11-22 17:11:58.987306] 19618        0x0000 → 0xfec7       ZigBee HA 51 ZCL: Discover Attributes, Seq: 6
    [2020-11-22 17:12:05.017988] 19640        0xfec7 → 0x0000       ZigBee HA 124 ZCL: Discover Attributes Response, Seq: 6
    

    Next step is to analyse the memory reservations in Discover Attributes.

    Ryan, I trust that you can look into that part.

  • There is nothing particularly concerning about an AF_INCOMING_MSG Discover Attributes Response unless your UART TX/RX buffers are not large enough to handle the message size.  The repetition of 0x0125 between the AF_INCOMING_MSG and XDATA variables indicates an overlap with the heap.  It can be assumed that MAXMEMHEAP is being surpassed, can you clarify what information is supposed to exist in the Discover Attributes Response from the sniffer log?

    Regards,
    Ryan

  • If MAXMEMHEAP  would be surpassed than the memory allocations should return NULL and the system should continue to fonction.

    So if MAXMEMHEAP can be actually surpassed, than there is a problem with osal_malloc not verifying the available memory correctly.

    I suggest that you look at my latest R&D work on the Z-STACK3.0.2 - by instrumenting the code, memory issues are detected early.  I can't do much about it as it is in the library code AFAICS.

    This issue may have a different cause but with my modification of Osal_Memory.c we will know that fairly easily.