Because of the holidays, TI E2E™ design support forum responses will be delayed from Dec. 25 through Jan. 2. Thank you for your patience.

This thread has been locked.

If you have a related question, please click the "Ask a related question" button in the top right corner. The newly created question will be automatically linked to this question.

MSP432P401R: BPSK Modulation/Demodulation

Part Number: MSP432P401R

I am trying to understand the Binary Phase Shift Key source code that TI provides on their website. When debugging one microcontroller as the modulator and another as the demodulator as shown in the BPSK documentation, the data recieved on the demodulator side does not correspond with the modulated data on the modulator side. Has anyone else encountered any issues with the source code in this link : http://www.ti.com/lit/zip/slaa681. does not help with debugging any issues with the modulation or demodulation. Currently I am debugging both sides by printing values and statements to know where the code is at in the execution; however, this is not efficient when the data do not match and the demodulator is not actually demodulating.

The data that I am receiving on the demodulator is either in the 16000s or less than 1000, which does not match up with the modulated data. The modulated data decreases linearly from a very high value to 1 or 0.

Example modulated data:

Packet Length: 200 

Mod: 1666 

Mod: 833 

Mod: 416 

Mod: 208 

Mod: 104 

Mod: 52 

Mod: 26 

Mod: 13 

Mod: 6 

Mod: 3 

Mod: 1 

Mod: 0 

Mod: 0

My question is how can I get the modulated data to match the receive data, and then get that data to be demodulated because it seems like the demodulator is continuously receiving data without actually demodulating. I am using the same source code that was provided from TI without much being changed.

  • Jerrell Gardner said:
    Currently I am debugging both sides by printing values and statements to know where the code is at in the execution; however, this is not efficient when the data do not match and the demodulator is not actually demodulating.

    Most likely you broke modem by adding your debug print. Don't add value printing, debug unchanged slaa281 code as it is - using debugger (in run/stop mode). When you know enough how both TX and RX parts of modem works - you supposedly will see where you can add some nonrealtime stuff like value print and where you cant'.

  • Are you familiar with slaa681 source code to know where I can add some realtime value print? Or how do you know how to figure out where I can put print statements?

  • You can try to put IRQ-based UART print right after FEC decode() function call. If you use polling UART code, most likely it will break modem realtime funciton and it will not work in result.
  • Ilmars said:
    Most likely you broke modem by adding your debug print. Don't add value printing, debug unchanged slaa281 code as it is - using debugger (in run/stop mode).

    In addition to the suggestion from Ilmars, if you are using the MSP432 Launchpad the on-board XDS110 supports the Cortex-M Hardware Trace Analyzer using SWO trace which allows some tracing of the program without having to modify the program and allows the program to run at full speed - see Statistical Function Profiling Configuration, Data Variable Tracing Configuration and Interrupt Profiling Configuration in the Trace Analyzer User’s Guide

    As for debug printing, using the ITM (Instrumentation Trace Macrocell) you can output software messages over the SWO port - see http://processors.wiki.ti.com/index.php/SWO_Trace#Software_Messages:. When using an XDS110 for SWO trace CCS configures the UART used for SWO trace at up to 12 Mbaud, and so using the ITM for debug messages will have lower overhead compared to other debug prints (such as to the CCS CIO console which requires the CCS debugger to halt and then resume the target).

  • What is an IRQ-based UART print? Does that mean that there will be an interrupt handler for the UART module and print out values after FEC decode function? If that's the case, how do I ensure the interrupt handle triggers after the FEC decode function?

  • I tried using the Statistical Function Profiling, Data Variable Tracing, and Interrupt Profiling configurations; however, the results were not inclusive. Statistical function profiling just showed how long I was in the main() which is not useful. Interrupt Profiling just showed the ADC interrupt being triggered which I already knew was working. I used data variable tracing on the demodulator to see the recoveryData array, threshold value, and what is being received from the ADC inside the ADC interrupt handler. The tracing did not return anything useful mostly ending in Bad trace data packet sequence or nothing at all, which does not make sense to me.

    I also tried the ITM software messages which is still confusing to me. I copied all the API functions from the link provided by you into the demodulator main file and used the ITM_put_16() with the ITM BASE ADDRESS as the port and the data as the decoded value after FEC decode function. This resulted in the same issue with Bad trace data packet sequence.

    I want to say the source code from slaa681 is working but I need proof that it is working with two MCUs sending and receiving data. Can you guide me through the steps to getting viable results from the Hardware Tracing Analyzer? As a side note: I am a senior undergraduate student with minimal knowledge about how to work with microcontrollers.
  • Jerrell Gardner said:
    The tracing did not return anything useful mostly ending in Bad trace data packet sequence or nothing at all, which does not make sense to me.

    If the MSP432 CPU clock frequency is changed after the trace analyser has been configured then the trace analyser can report Bad trace data, due to the SWO receiver in the XDS110 debug probe and SWO transmitter in the MSP432 being set to different baud rates.

    If you only start the hardware trace analyser after the example code has called systemClockInit() to initialise the MSP432 clocks, does that allow valid trace data to be displayed?

  • Jerrell Gardner said:
    What is an IRQ-based UART print?

    IRQ-based print does not block application code for whole string transmission time, it will put string into buffer so it can be transmitted "in the background". Note that at 9600bps polling UART transmission of just 10 chacacters will take 1/96 seconds, your BPSK modem will be stopped for the same time. Of course, results depends on modem architecture and its receive waveform buffer size.

    Do you have scope? First thing I would do - eliminate transmitter from equation having many unknown variables. - I would check that transmitter is working properly and transmitting proper signal, it is wired to receiver correctly. When you know that transmitter is ok, you know that half of whole system is ok and you can work on remaining half of your problem.

  • Yeah I used the scope to look at the Transmitter signal. When I stepped through the debugging of the Transmitter modulation, the signal was matching the carrier signal when modulating bit '0' and inverting the signal when modulating bit '1'. So I concluded the transmission was modulating properly based off that. Now, I am trying to debug the receiver end which is much trickier to do because there are no output signals. 

    If I put a IRQ-based print inside my ADC interrupt where will I see the print values? Do I have to specify another pin for output and analyze that signal on a scope?

  • If I start the hardware trace analyzer then I get the popup that states that the clock frequency couldn't not detected. It seems the only way to use the trace analyzer is with a fresh debug session without manually setting the UART clock frequency.

    I wanted to see the data trace of the "task" variable; but after having the modulator on and demodulator on for a while, the trace viewer shows 11 entries at the same time 0. Which makes me believe the task is not changing. I am most positive that the modulation outputs a signal so its not making any sense for why the trace viewer doesn't increase in time.
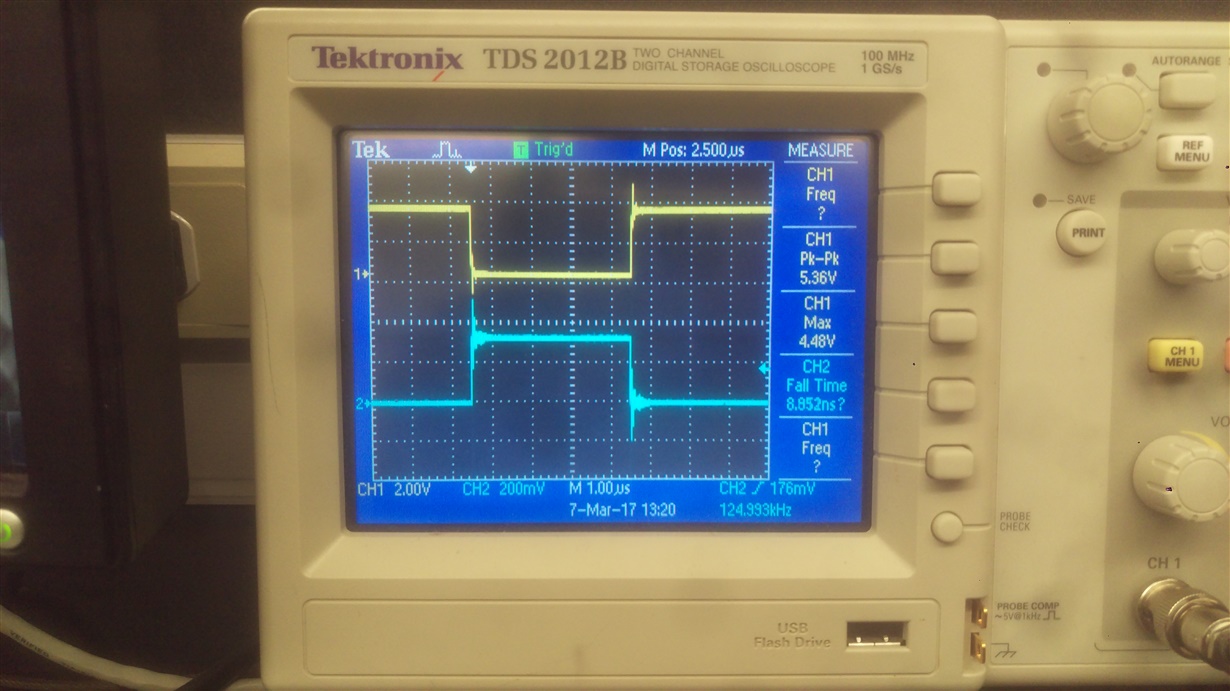
  • I tested the transmitter again and got the same results as previously. The blue signal is the carrier signal and the yellow is BPSK waveform.

**Attention** This is a public forum