

President Ronald Reagan frequently said “trust but verify” when discussing U.S. relations with the Soviet Union. Some say it comes from a Russian proverb, “doveryai no proveryai.”
Trust but verify is exactly what you should do when using SPICE operational amplifier (op amp) macromodels. For op amp stability analysis in the AC domain, you need to verify that both Aol (open loop gain) and ZO (open-loop output impedance), two key things for op amp stability analysis, are correct for the op amp macromodel.
Figure 1 shows an AC model for an op amp with Aol and ZO. Since most SPICE op amp macromodels end up being modeled correctly for Aol, l’ll focus on verifying ZO, which is often not modeled correctly. Note that there is not industry consistency in terminology for open loop output impedance. Both Ro and Zo are used.

Figure 1: Op amp AC model
Figure 2 illustrates the important differences between ZO and ZOUT. ZO is the open-loop output impedance of an op amp. ZOUT is defined as the closed-loop output impedance of an op amp.
ZO and ZOUT are related. ZOUT is ZO reduced by loop gain. Figure 2 shows how the relationship between Zo and Zout is derived.
This simplified op amp model focuses solely on the basic DC characteristics of an op amp. A high input resistance (100mΩ to GΩ), RDIFF develops an error voltage across it, VE, due to the voltage differences between -IN and +IN. The error voltage, VE, is amplified by the open-loop gain factor Aol and becomes VO. In series with VO to the output, VOUT, is ZO, the open-loop output impedance. Using standard circuit analysis, the resulting relationship between ZO and ZOUT is shown.

Figure 2: ZO vs. ZOUT
Figure 3 is the SPICE circuit for testing the ZOUT of an op amp. An AC current source, IOUT, with the DC portion set to zero is injected into the op amp output. You do not want any DC current injected into the op amp output, since ZOUT becomes lower with current in the output. The worst-case stability problems almost always occur with the highest ZOUT.
For this test, I set the op amp closed-loop gain to 1 to check against the Gain = 1x test data in the data sheet. SPICE performed a DC analysis before it ran the AC analysis. You must confirm that the amplifier is not in output saturation for the DC analysis or else the AC analysis will not be meaningful.
DC analysis showed the output of the LMV844 to be 500µV for a gain = 1, which reflects an expected input offset voltage for this part. If Aol in the op amp macromodel matches the data sheet, then you know ZO is correct based on Figure 2. VOUT will become ZOUT since the AC analysis will report all voltage probes relative to IOUT, the excitation. The AC analysis will compute VOUT = IOUT * ZOUT and report this as a gain of VOUT/IOUT = ZOUT.
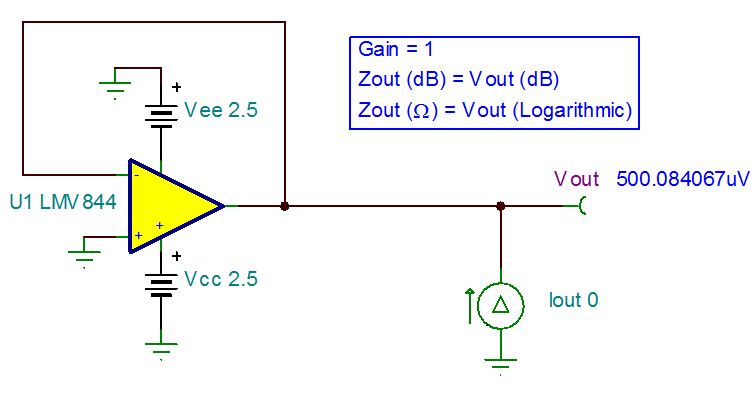
Figure 3: ZOUT SPICE measure
My SPICE test result of the LMV844 macromodel indicates that ZOUT does not match the data sheet for a gain = 1. Figure 4 shows two slopes (+20dB/dec and +40dB/dec) on the data sheet ZOUT for a gain = 1 and only one slope (+20dB/dec) for the macromodel ZOUT. If you see this in your application, you will need to contact the op amp manufacturer to get a SPICE op amp macromodel with the correct ZOUT for stability analysis. Like Zo, there is not industry consistency in terminology for closed loop output impedance. Both Rout and Zout are used.
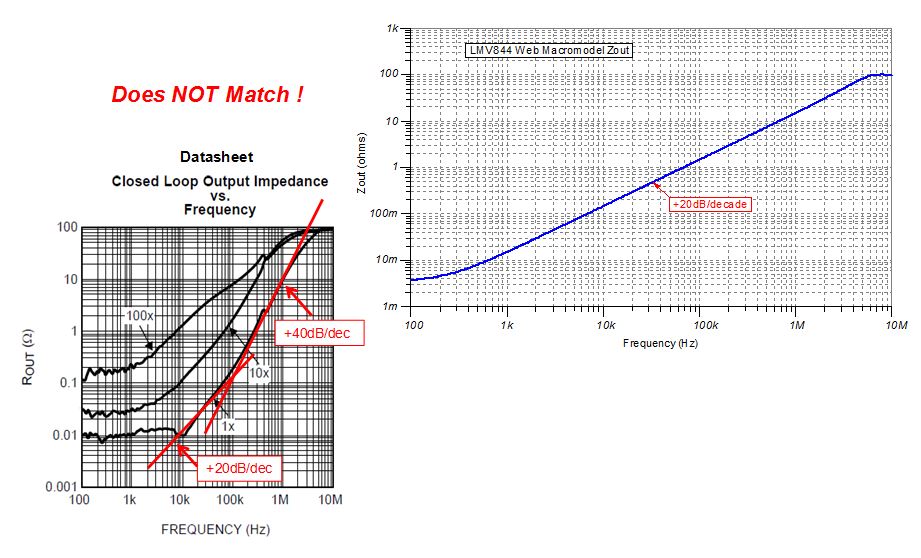
Figure 4: LMV844 macro vs. data sheet
I will use the test circuit in Figure 5 to measure ZO, open-loop output impedance. SPICE will perform a DC analysis before it runs the AC analysis. You must confirm that the amplifier is not in output saturation for the DC analysis or else the AC analysis will not be meaningful. In the circuit of Figure 5, L1 will act as a short at DC but an open for any frequency of interest. Conversely, C1 will act as an open at DC and a short for any frequency of interest.
DC analysis shows the output of the OPA376 to be at -25.38µV for a gain = 1, which is an expected input offset voltage for this part. Just like the Zout test, use an AC current source, with DC component of it set to zero, to back-drive the output of the op amp. VOUT will become ZO since the AC analysis will report all voltage probes relative to IOUT, the excitation. The AC analysis will compute VOUT = IOUT * ZO and report this as a gain of VOUT /IOUT = ZO.

Figure 5: ZO SPICE measure
Figure 6 confirms that the SPICE op amp macromodel does indeed match the data sheet. There are two curves for ZO in the OPA376 data sheet. Since I am interested in the unloaded ZO, output with no load current, I will compare the SPICE simulation against the 400µA load current Ro curvet in the data sheet. Remember that ZO decreases with current in the output stage. You need to know the largest ZO, which will almost always cause the worst stability issues.

Figure 6: OPA376 macro vs. datasheet
You now have a quick and easy way to trust but verify SPICE op amp macromodels for the proper ZO or ZOUT. The correct ZO or ZOUT will allow you to simulate, predict and build stable op amp circuits for your end applications. For more detailed information on op amp stability, check out the resources below.
Additional resoucres
- Learn more about op amp stability on the TI E2E™ forum under Prescision Amplifiers, Precision Amplifier Wiki.
- Check out TI Precision Labs and learn all about precision op amps.
- Take a look at our free TI TINA-TI™ SPICE simulator.
- Learn about TI’s entire portfolio of amplifier ICs and find more technical resources.