

Power supply rejection ratio (PSRR) describes how well an operational amplifier (op amp) rejects variations in power supply voltage. PSRR is defined as the shift in offset per volt of shift in power supply, and generally is given units of micro-volts per volt (uV/V).
The OPA209, for example, has a typical PSRR of 0.05uV/V. Thus, for the OPA209, the power supply can change 1V with only 50nV of shift in offset (see Figure 1). This error is insignificant compared to the typical offset (35uV). Furthermore, supplies in precision systems generally have less than a volt of variation. This might lead you to conclude that you can ignore errors from power supply variation for devices with good PSRR, like the OPA209. The problem is that the specification in the data table is the dc PSRR, and often the ac PSRR is the limiting factor.
|
PARAMETER |
|
CONDITION |
OPA209, OPA2209, OPA4209 |
UNIT |
||
|
|
MIN |
TYP |
MAX |
|||
|
OFFSET VOLTAGE |
|
|
|
|
|
|
|
Input Offset Voltage |
Vos |
Vs = ±15V, VCM = 0V |
|
±35 |
±150 |
µV |
|
Vs Power Supply |
PSRR |
Vs = ±2.25V to Vs = 18V |
|
0.05 |
0.5 |
µV/V |
Figure 1: Input offset and PSRR Specification for OPA209
Figure 2 shows the ac PSRR curve for the OPA209. You’ll often find a high-frequency noise signal superimposed on the dc supply voltage. This high frequency noise may be the ripple of a switching power supply. The low frequency PSRR is very good, which improves the rejection of low-frequency power supply variations. On the other hand, high-frequency power supply noise rejection is poor because PSRR is low at high frequencies.

Figure 2: PSRR vs. Frequency for OPA209
The simulation results in figure 3 illustrate how the reduced PSRR at high frequencies introduces errors. In this example, a 10mV, 100kHz signal is superimposed on the power supply (Vs = 15V ± 10mV). The power supply noise is attenuated by 45dB PSRR at 100kHz and reflects as an input offset voltage variation. Notice that the output has the power supply noise and the input signal superimposed on each other.
Figure 4 gives the hand calculations for the circuit in figure 3. Note that the hand calculations compare well with the simulated results (Simulated output noise = 11.9mVpp, Hand Calculated output = 11.2mVpp).
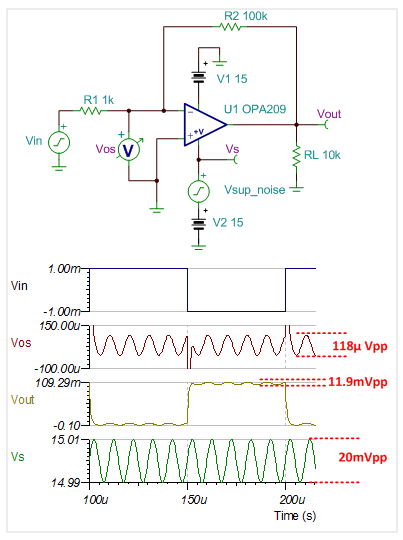
Figure 3: Application example showing PSRR at high frequency

Figure 4: PSRR calculation for application example
In general, it is important to consider the effects of PSRR over frequency, because the PSRR specification degrades at higher frequencies. You can apply the same principle to common mode rejection. Knowing this, I hope you aren’t taken by surprise by high-frequency PSRR.
-

JOHN AN
-
Cancel
-
Vote Up
0
Vote Down
-
-
Sign in to reply
-
More
-
Cancel
Comment-

JOHN AN
-
Cancel
-
Vote Up
0
Vote Down
-
-
Sign in to reply
-
More
-
Cancel
Children