A related question is a question created from another question. When the related question is created, it will be automatically linked to the original question.
If you have a related question, please click the "Ask a related question" button in the top right corner. The newly created question will be automatically linked to this question.
You can use the conversion time and averaging settings to configure the INA to the desired conversion time. Note the total time to get a result is the conversion times of the active channels added together and then multiplied by the number of averages: (VBUSCT + VSHCT)*AVG.
Also, if you are using the ALERT feature, the alert will trip on the conversion value, not the average value, so you can choose a balance between conversion time and averaging based on how accurate or fast you want the alert.
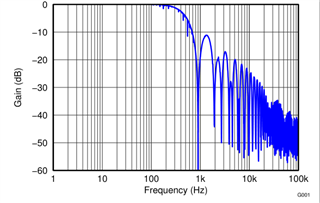
This shows that higher frequency measurements get filtered out. Note that Figure 7-3 (ADC Frequency Response) is for a 1.052 ms conversion time only, and that the cutoff frequency will change depending on your conversion time and other conversion settings, such as averaging and enabled channels.
Is the device suitable for sampling 100Hz output current waveforms?
This will depend on your settings. You can choose different conversion and averaging settings, so you'll want to choose a combination that is fast enough for your needs. You can look at the ENOB table (Table 8-2) in the datasheet to get an idea of the noise free resolution for each conversion time and averaging combination. This will also show you the total output sample period if converting with one channel only.
This shows the nose with different conversion time settings. The longer your conversion time, the less noisy your measurement will be. Similar to the answer above, yo can look at the ENOB table to get an idea of noise for different settings.
Sorry, for the above message I was looking at the INA228 datasheet, not the INA226. The response is generally the same for the INA226, only the conversion time for the frequency plot will be 1.1ms instead of 1.052. Also, the INA226 does not have an ENOB table available, but the concept will be the same. You can still calculate the total conversion time easily based on the number of averages, and the longer the conversion/averaging, the less noisy the measurement will be. You can look at the ENOB table for the INA228 to get an idea of how this changes with settings. The ENOB table for the INA238 may be more useful as an example, since it has the same number of bits as the INA226.