This thread has been locked.
If you have a related question, please click the "Ask a related question" button in the top right corner. The newly created question will be automatically linked to this question.
Hi ,
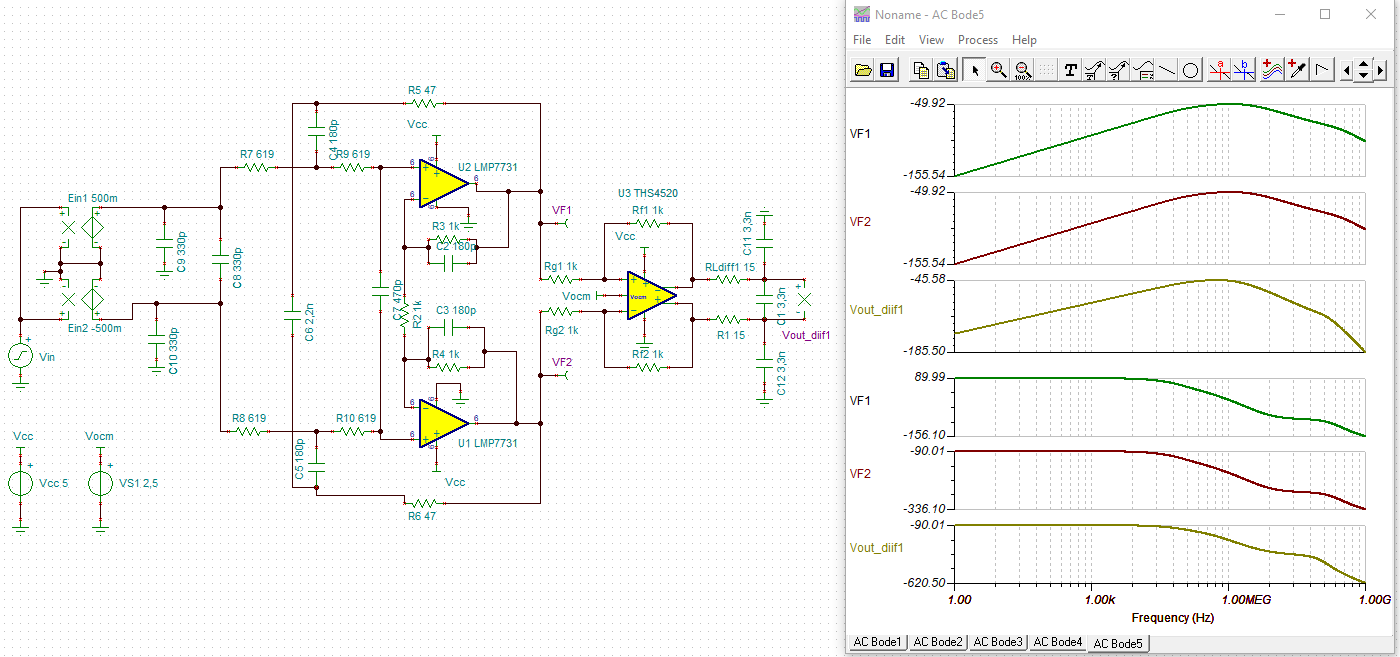
I want to know if it is possible to measure phase delay and group delay with Tina TI ?
If yes can you suggest the steps to plot the same ?
Thanks & Regards
Riddhee
Run your AC sim using a linear F sweep, there might be a utility to report phase linearity and prop delay from that, or dump the data to excel and extract from there.
Hi Riddhee,
Can you share the schematic with us?
If you want to know exact phase delay, please follow Michael's suggestions. If you want to know the approx. phase delay, you can measure it via Tina simulation. For single pole system, The phase delay starts a decade earlier from a pole (5.73 degree) and it ends a decade after the pole (84.3 degree).
For a group delays will be a slightly complicated, but we have to see if it a closed loop or open loop system. What is your application? Are you check for the op amp stability issues or something else?
Best,
Raymond
And also,
We used to do a lot of linear sweep group delay measurements on the early CFA parts which were basically linear phase, constant group delay - we were doing that for a number of reasons but keep in mind, the package delay will add to the simulated group delay - literally depends on package size - if you need that level of accuracy.
And of course to make that package delay measurements you have to do a through calibration including the board with the I to O shorted out.
Hi michael ,
I ran the linear frequency sweep but am unable to extract the data from the plot .
Hi Raymond,
I have built the attached simulation file based on the schematic provided by the customer, as below
Its a sallen-key differential low pass design. I am unable to get the desired response at low frequencies. Can you help me identify the problem
Regards,
Riddhee
Hello Raymond, Kai,
I followed your instructions for extracting the data from the Plot of AC linear frequency sweep result but the exported text files turned out to be blank
And as for the frequency response, since it is a low pass filter, I was expecting a higher gain at low frequencies.
The frequency response with logarithmic scale :
I want to know why the gain is dropping at lower frequencies.
Thanks & Regards,
Riddhee
Hi Riddhee,
because your input signal exceeds the common mode input voltage range.
Kai
Hi Riddhee,
Thanks for Kai's analysis.
Regarding to your output file, I exported the bode plots generated from the circuit above, see the attached file.
/cfs-file/__key/communityserver-discussions-components-files/14/tcurve-05132020.dat
Best,
Raymond
Thanks a lot Kai,
I fixed my simulation file accordingly and I am able to see expected response.
Thank you Raymond for extracting the results for me.
Your solution was helpful.
Best Regards,
Riddhee Abhyankar