Because of the Thanksgiving holiday in the U.S., TI E2E™ design support forum responses may be delayed from November 25 through December 2. Thank you for your patience.

This thread has been locked.

If you have a related question, please click the "Ask a related question" button in the top right corner. The newly created question will be automatically linked to this question.

OPA365 Maximum Output Voltage vs Frequency

Other Parts Discussed in Thread: OPA365

I would like to confirm Maximum Output Voltage vs Frequency for OPA365.

The customer will use it for 500kHz signal input. And the output will be full scale for the specification (about 4.8V output).

So, they want the figure for Maximum Output Voltage vs Frequency like the figure I attached.


Could you please give it for OPA365? If you can not, could you please give the substitution?

Best regards,

Atsushi Yamauchi


  • Yamauchi,

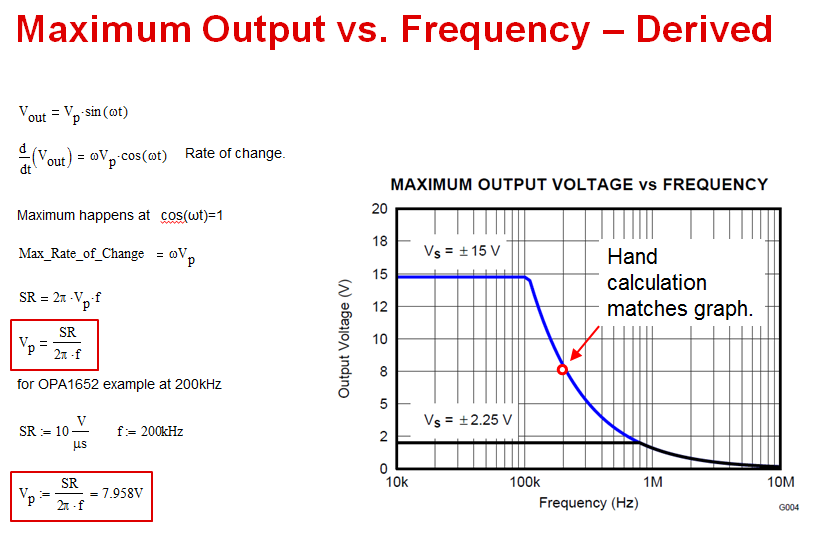
    OPA365 Maximum Output Voltage vs frequency curve is based on the slew rate - see derivation of the equation below:


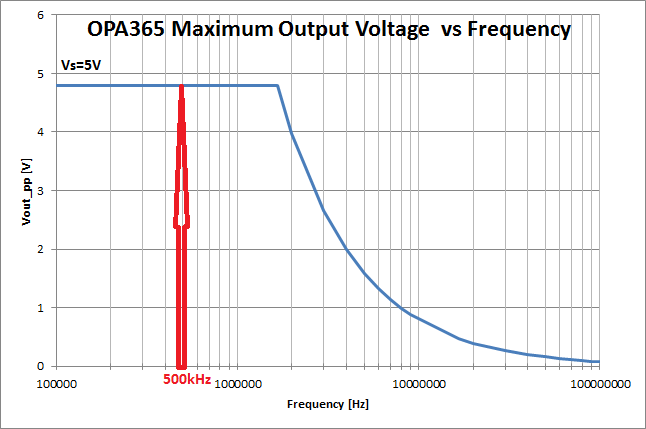
    Therefore, by using the formula above, Vp=SR/(2*Pi*f) or Vpp=SR/(Pi*f), you may generate your own graph as shown below. Since the input signal of Vpp=4.8V is being applied (btw, this is the absolute maximum allowable for Vs=5V supply- see below max 100mV swing to either rail), I used Vpp=SR/(Pi*f) formula to generate the graph below.  As you may see in the graph, what will limit the Vout up to f=~1.6MHz is the swing to the rail and not slew rate.