- Ask a related questionWhat is a related question?A related question is a question created from another question. When the related question is created, it will be automatically linked to the original question.
Hello,
We are using the DAC38RF89 and we encountered a problem at -20 deg temperature.
The output transmits 200M to 4G at full scale power.
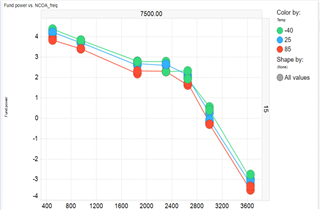
The power delta at 25 deg is about 6dB for this frequency bandwidth, between the power at the low frequency and the power at the high frequency, according to the datasheet.
AT -20deg we got about 11dB delta at this bandwidth between the power at the low frequency and the power at the high frequency.
Is there a graph or a table that can indicate the relation between the output power to the temperature?
We have a blin at the output of the DAC, but the attenuation of this balun at -20deg is almost constant and about 1dB.
Best regards,
Asaf Abraham